How To Find Ascending Bases That Lead To Powerful Advances
In a choppy market, leadership stocks
sometimes act like runners on base. The player leads off, is forced back when the pitcher throws to first, then steals second and
leads off again. When the next batter up blasts one for the fences, the man at
second explodes, rounding third base, then slides home.
The same behavior sometimes occurs in
strong, momentum stocks ahead of market turns to the upside. A leader will
consolidate, charge higher, pull back, consolidate, advance again, then pull
back again. Each time, like a runner stealing bases, the stock never quite
breaks loose, but still makes progress, forming a series of higher highs and
higher lows. When at last the market comes alive, the resistance lifts, and the
stock flies on a breakout.
That’s the profile of the ascending
base, a rare and tricky pattern that can lead powerful advances in
leadership stocks. In this pattern, the stock will form three successive
consolidation zones. Some may be long enough — five weeks — to be called a
base.
The first two breakouts will fail, but
then, rather than selling off, the stock forms a successive zone characterized by
higher highs and higher lows than the prior zone. The third, final zone should
tighten relative to the ranges of the prior zones. The breakout from the third
zone is where you buy (remembering, of course, to set an initial stop to protect
you in the event the breakout fails).
America Online
(
AOL |
Quote |
Chart |
News |
PowerRating) broke out of
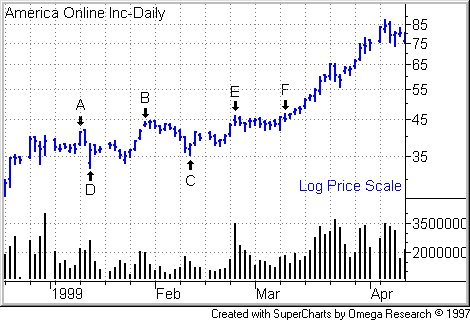
an ascending base in early 1999. Prior to the breakout, the Internet giant was a
clear leader, having more than tripled in price from its Oct. 8, 1998 low.
On Jan. 11, 1999, AOL shares broke out
of two-week consolidation zone (see Point A on
the chart), then promptly failed the next session. Rather than selling off, the
stock recovered quickly and two weeks later staged another breakout attempt (Point
B).
This second rally failed a few days
later. But notice how the stock consolidated rather than corrected. The low of
this second zone (Point C) came in well
above the low of the first zone (Point D).
On Feb. 23, the stock moved to new
high ground (Point E), then fell back as
well. Notice how AOL underwent an extreme volatility contraction from here. In
effect, the stock formed a handle. The breakout came on March 9 when the stock
exceeded the handle high (Point F).

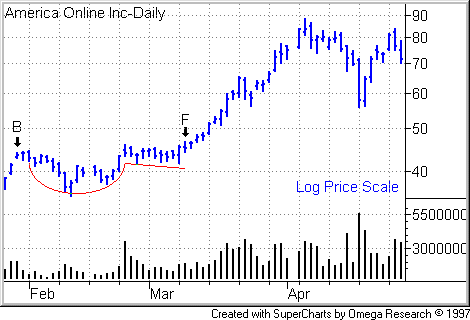
Taking a closer look, even if you were
unfamiliar with the ascending base, you could have recognized a cup-with-handle
pattern, albeit without the heavy volume that makes for the perfect handle
breakout.

JDS Uniphase
(
JDSU |
Quote |
Chart |
News |
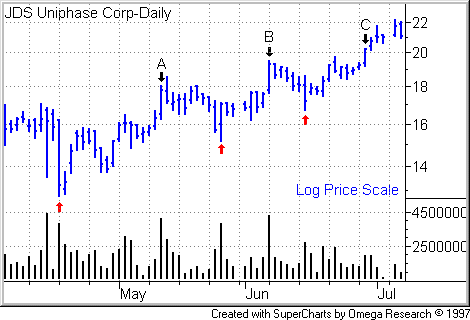
PowerRating) formed an
ascending base later that same year. Shares in the fiber-optics gear maker
staged failed breakouts on May 12 (Point A)
and June 7 (Point B) before the third time
proved the charm on June 29 (Point C). Note
again how each successive zone formed a higher bottom (indicated by red
arrows in the chart).

For The Best Trading
Books, Video Courses and Software To Improve Your Trading
