The Art Of The Bull Trap
The lesson examines the
art of playing the “bull trap.” This situation occurs when
the price of a stock moves above a resistance line, triggering buy signals, but
then quickly reverses course, “trapping” with losses those who went
long. These situations can occur on all time frames, and with all patterns that
have a resistance lines.
The examples I picked for this lesson are taken
from the intermediate-term perspective. In bad markets like the one we’ve been
having, failed breakouts are a common thing. Ideally, we look for a breakout as
an opportunity to go long with a stop loss set at 7% to 8% below a buy point —
though when the stock breaks out, then suddenly sells off back into its base, it
can often be setting up a profitable swing trade to the short side.
The strategy I am going to discuss is for the
more nimble and aggressive trader. Intermediate-term trading and swing trading
can seem worlds apart when it comes to interpreting information and making
decisions. The level of risk for going short is often higher than the long side,
and the time frame here can be very short. Keep in mind it is always a good idea
to go into a trade with an idea of what you want out of it, and always have a
stop loss pre-programmed.
Harley Davidson
(
HDI |
Quote |
Chart |
News |
PowerRating)

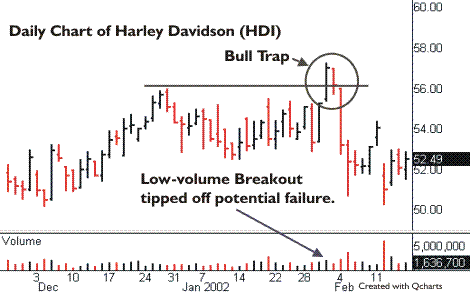
In the example with Harley
Davidson
(
HDI |
Quote |
Chart |
News |
PowerRating) above, the stock built a six-month base, formed a
handle, then finally broke through the resistance line at 52.51. On the second
day after the breakout, the stock plummetted, creating a “bull trap”
for those who bought the breakout. The third day after the breakout saw further
selling pressure.
An ideal entry into this setup would have been
where the price began to go lower than its breakout. Taking a position at the
end of the second day after the breakout appeared to be ideal, as heavy selling
accompanied the move. Covering a short position on this one was a tough call.
The obvious signs of downward pressure in the high-volume bars reversing the
breakout were a good indication that the stock’s path of least resistance was to
the downside, and depending on your own tolerance, a profit of a couple of
points and a quick exit may have suited you fine.
A closer look at this stock shows signs as to why
the breakout may have failed. In analyzing the handle, we can see that the
volume on the down days, for the most part, exceeded that of the up days. This
suggested that a breakout might not be as well supported. The volume for its
breakout was 39% above its average daily volume, and just shy of the 40%
intermediate players use as a minimum for a breakout. To further add to why the
stock may have failed, it didn’t make our IT Report because its revenue was
below 20% for the last two quarters. The company also recently made the cover of
Forbes Magazine as “Company of the Year,” an often punishing
reward for a company’s stock.
THQ Inc.
(
THQI |
Quote |
Chart |
News |
PowerRating)

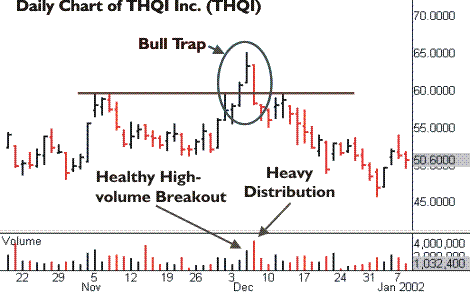
In the example above, we have THQ
Inc.
(
THQI |
Quote |
Chart |
News |
PowerRating) as it came out of a month-long base. The breakout
looked good as it cruised above its resistance line on high volume, but was
foiled when a complete reversal of the price action erased the gains with even
higher volume. This action created another “bull trap,” and also
marked a new downtrend for the stock.
A nimble trader watching this action may have
entered a short position at the close on the day after the stock broke out. At
this point, traders who took the breakout were panicking because they had an
immediate loss. A short entry here would have netted a few points in the next
couple of days, and depending on stop-loss tolerance, you may have held out for
even further profits. Another way to play this is to recognize that the stock
failed to carry through on a breakout, then look for clues in the following
sessions for signs of the stock topping out.
Early warning for this action may have been
provided by the fact that the stock showed some significant selling pressure in
the days preceding the breakout (note the high volume down days.) Another sign
of weakness was that this stock was in a bad market and a member of a weak
industry group.
Integra Life Sciences
(
IART |
Quote |
Chart |
News |
PowerRating)

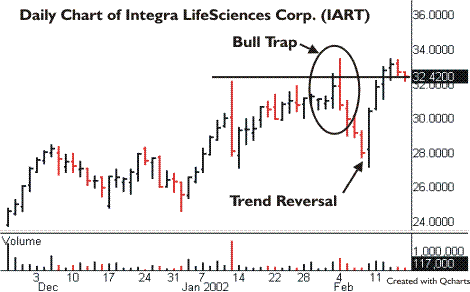
Here we have Integra
LifeSciences Corp.
(
IART |
Quote |
Chart |
News |
PowerRating) as it broke out of a three-month base
on over 70% of its daily average volume. The next day the stock shot even
higher, though eventually succumbed to a sell off that took out all the gains
made on the breakout. This is exactly what someone going long on a breakout does
not want to see.
As with the examples above, a way to take this is
to go short once the breakout gains were reversed. A short position taken at the
close, the day after the breakout, would have been good for at least a couple
points in three days. Not bad considering how much you would have made going
long on the breakout. The chart for this one also shows how taking a quick
profit is a good idea with these set ups. After going down for three days, this
one put in a trend reversal and eventually sailed to levels above its breakout
point. For the record, intermediate-term players would have been stopped out of
this one when the stock went 7%-8% below a pivot buy point of 32.30.
Unlike the previous examples, this stock had a
lot of things going for it. It met the strict criteria of fundamentals and
technicals to be an intermediate-term selection, had a nice long base, and was
showing signs of accumulation into the breakout. On a negative note, it was in a
bad market and didn’t have a healthy handle with a shakeout. So what made this
one fall apart? Who knows. In this business it’s important to be able to
recognize a high-probability set up and take a swing. The cue here was the
reversal the day after the breakout.
Direct Focus Inc
(
DFXI |
Quote |
Chart |
News |
PowerRating)

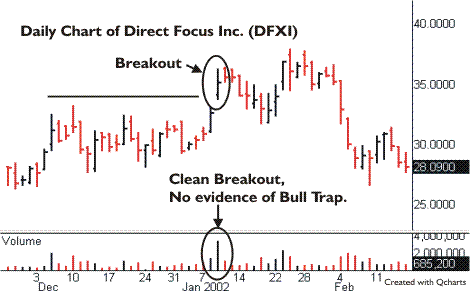
On this breakout with Direct
Focus Inc.
(
DFXI |
Quote |
Chart |
News |
PowerRating), no signals were given to create a “bull
trap” or even go short. The stock broke out on over six times average
volume, though failed to move up until a couple of weeks later. Despite the
price action dropping below the breakout zone, no sell signals were triggered on
the daily bars, nor marked by distribution. In an ideal “bull trap” we
want to see the action happen quickly to create a panic for buyers. This stock
was another intermediate-term candidate, though it didn’t last long before
triggering an 8% stop loss. The above example is given to compare with for what
not to take as a “bull trap” set up.
Summary
To sum up, “bull traps” are an
aggressive way to turn a quick profit off of a failed breakout. Those who
examine breakouts closely have probably noticed this pattern occurring quite a
bit in this market. These situations aren’t the easiest to predict, and they’re
more of a reactionary move, but it pays to do your homework. You can keep an eye
on potential candidates through our Cup
and Handles list, or Stocks
Building a Base list. Also be sure to
check out our lesson
on handles, as the clues for a stocks success can often be found in this
portion of a pattern.
For The Best Trading
Books, Video Courses and Software To Improve Your Trading
