Will This Bull Cycle Trade Higher?
From 1990 to 1997, Kevin Haggerty served as Senior Vice President for Equity Trading at Fidelity Capital Markets, Boston, a division of Fidelity Investments. He was responsible for all U.S. institutional Listed, OTC and Option trading in addition to all major Exchange Floor Executions. For a free trial to Kevin’s Daily Trading Report, please click here.
The Fed didn’t raise rates Wed which is no surprise, and the market didn’t like the “con man’s” state of the union speech as the SPX traded down to a 1078.46 intraday low and a 1084.53 close (-1.2%). The market has declined -6.2% high to low in 7 days, and is obviously ST-O/S. The previous decline from 1101.36-1029.38 (1021/09-11/2/09) was 8 days, and the one before that from 1080.15-1019.95 (9/23/09-10/2/09) was 7 days, and then reversed on day 8, which is where we are today at month end for the Generals.
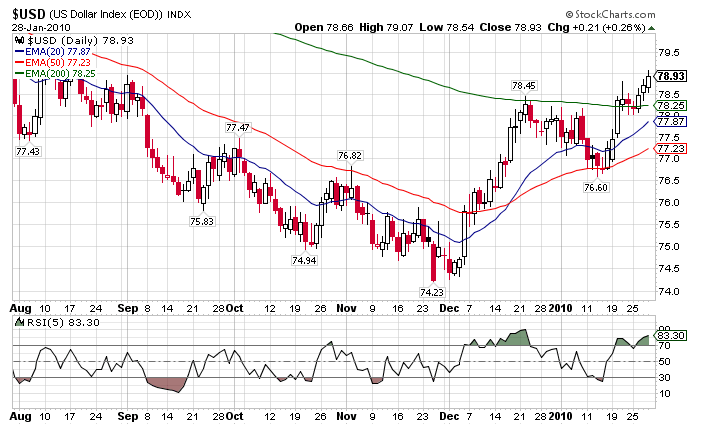
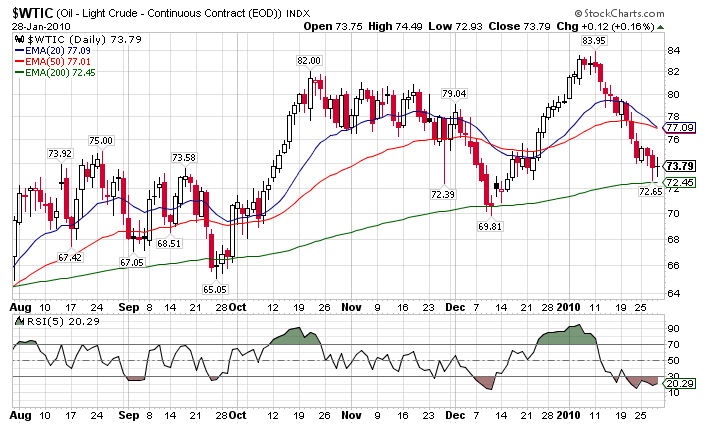
The USD rally made a new high yesterday at 79.07 and closed at 78.93. This has put pressure on gold, crude, commodity stocks, and of course the SPX. Crude oil declined to 72.65 on Wed versus the 200DEMA at 72.45, and went out yesterday at 73.79, so it is ST-O/S, and well positioned technically for a bounce after the 12 day decline from 83.95 Both the SPX and crude oil (WTIC) are Fib days today at 8 and 13, so a bounce is no surprise.
There was a “funny money” GDP number this morning at 5.7% versus a 4.7% consensus, and a high estimate at 6.8%. The empty suits on CNBC immediately hyped it, but to their credit did mention that it is inflated by an inventory buildup, which is a sign of weakness not strength. A high number was expected by all so why was the SPX -1.2% yesterday.
The SPX has declined from a key price and time zone, and hit the initial .236RT to 869.32 from 1150.45 at 1084.10, with lows the last two days of 1083.11 and 1078.46 It is ST-O/S, and today is month end, so in addition to the inflated GDP number the Generals are in position to make up some ground versus the 1115.10 12/31/09 close.
If there is a bounce from this .236RT zone, which is also the 180 degree angle from 1150.45, the immediate RT levels in play from the 1078.46 low versus the 1150.45 high are 1095.45, 1105.96, 1114.45, and the .618 at 1122.95.
The most significant price zone for buyers after any immediate RT followed by a decline to lower lows is 1046-1040, which includes all of the long term EMA’s, in addition to key price and angle symmetry. The market will most likely reverse from just above or below that zone, because the market rarely accommodates the “herd” at such an obvious technical level.
Yes, I still think this bull cycle will hit the 1229 .618RT zone (1200-1260).
Have a good trading day!
Click here to find full details on Kevin’s courses including Trading with the Generals with over 20 hours of professional market strategies. And for a free trial to Kevin’s daily trading service, click here.


