Allocating Money in the Market at Higher Rates of Return
Today’s economic climate doesn’t offer many growth vehicles for your money – say that lump sum that you took at retirement. You may have a million dollars, but a low-risk CD is only going to pay you $30,000 to $40,000 annually, and you won’t really feel like a millionaire. That’s the boat that many Americans find themselves in. They have a hearty lump sum, but they don’t know where to put it to earn a decent return. My goal is to deploy money in quality stocks such that I earn 15 to 20 percent annual gains with minimal risk. Granted, I’ll still be exposed to the extreme whims of the market. Here, I want to demonstrate a technique that utilizes the sell off following an earnings report, something we’re seeing frequently these days.
In an earlier article, “Intraday Trading High-Quality Stocks,” I presented a setup (CCI(35) less than -150 and RSI(2) less than 10 on 2-minute charts) and trigger (close above its10-period moving average) that defined an oversold market condition ripe for trading intraday the downtrend reversal. I want to use them again here. After an earnings report, these quality stocks usually sell off because they’ve had a profitable run and institutions take some money off the table and put it to work somewhere else. Invariably though, they’re waiting around at significant support levels (50-, 200-day moving averages and standard Fibonacci levels) to step in again and start buying. Remember, in this approach, my goal is to deploy money at a fair rate of return.
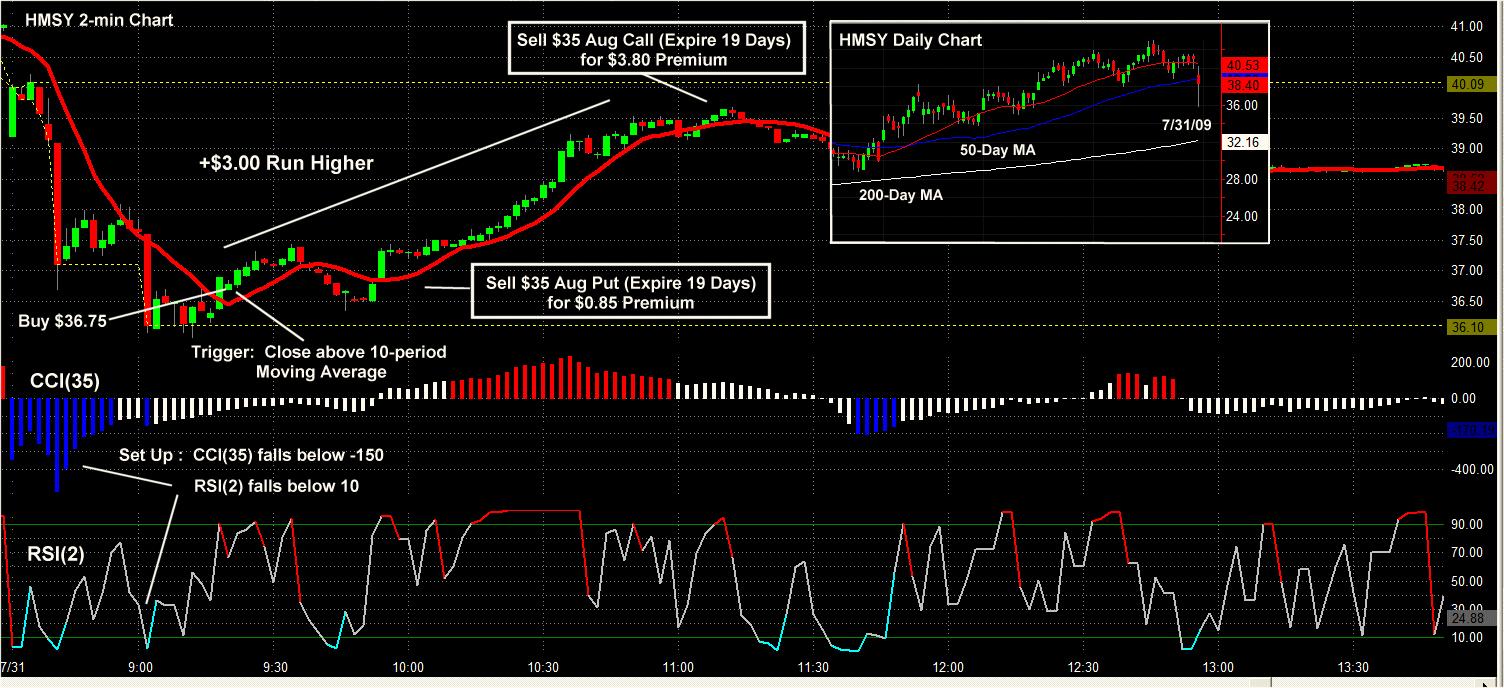
HMSY is a quality stock. Fundamentals are good with a Zacks rank of 2, earnings growth of 27, 44, 73 and 75% over the past four quarters, and value remaining in its current price with two year PEG ratios of 1.09 and 0.99. It reported earnings before the open on 7/31/09 and then delivered the intraday chart shown above (with its daily chart inserted). It’s a typical sell off, bottoming in the first half hour of trading, followed by a recovery into the close.
The daily chart shows the day gaped down big time at the open, proceeded to fall further then finished the day recovering to form a “hammer” candle. Bearing in mind that I want to deploy cash in this quality stock and at the same time provide some downside protection, I like two approaches. First, wait for the intraday setup (CCI(35) and RSI(2) criteria) and trigger (close above 10-period moving average). Then, either buy shares, wait for the run higher and sell in-the-money Calls or sell out-of-the-money Puts as soon as the trade triggers. Consider the risk/reward scenarios for each of those plays.
The first strategy buys shares at $36.75, lets price run higher as the oversold condition reverts (like a stretched rubber band becoming taught), then sell the $35 Aug Call for its $3.80 premium. With 1,000 shares and 10 contracts, we invest $32,950 over the next 19 days and earn $2,050 ($38,800 – $36,750) or 6.2% (119.5% annualized) if HMSY were to remain above $35 or somewhat less – but still profitable – if it were to fall from there to $32.95 ($36.75 – $3.80). In fact, price could fall to $33.44 over the next 19 days, and we would still earn 1.5% (28.8% annualized).
The second strategy (selling Puts as soon as the trigger is hit) would sell the $35 Put for its $0.85 premium. If price were to remain above $35, we would invest $34,150 to earn $850 (2.5%) over the next 19 days. Since price was then at $36.75, we had 7.1% downside protection. In this instance, price could fall to $34.49 over the next 19 days, and we would still earn 1.5%.
Obviously the Call strategy returned more and risked less, but the Put approach would have become profitable faster as price made its $3 run higher and offered an immediate profit by closing the position with 50 to 80% of the gain. Let’s look at a second example.
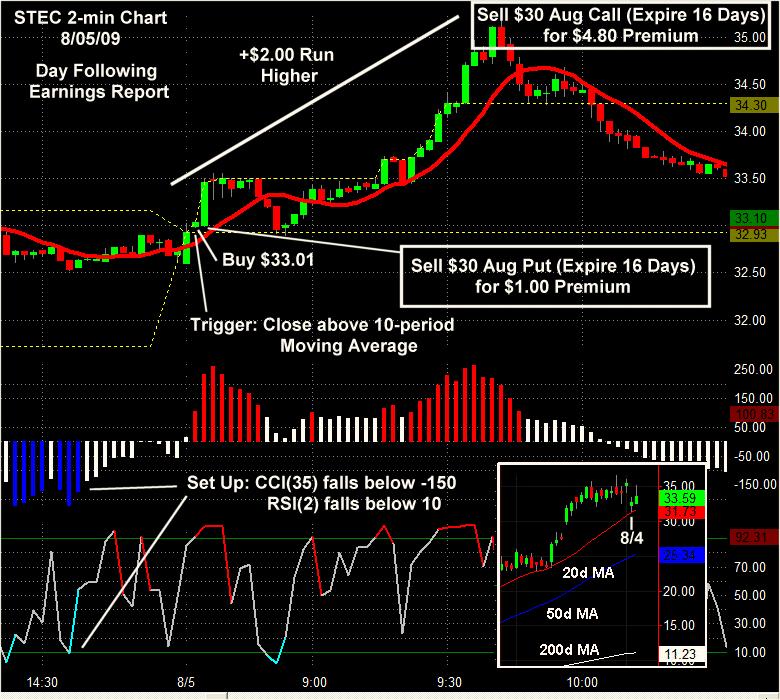
If HMSY is a stock with good fundamentals, STEC is a great one with a Zacks rank of 1, earnings growth of 100, -29, 71 and 486 % over the past four quarters, and value remaining in its current price with two year PEG ratios of 0.10 and 0.38. Further, this year’s earnings estimate has increased 196% over the past 90 days. It reported earnings before the open on 8/04/09 and then delivered the intraday chart shown the next day (again with daily chart inserted).
The Call strategy buys shares at $33.01, lets price run $2 higher as the oversold condition again reverts, then sell the $30 Aug Call for its $4.80 premium. With 1,000 shares and 10 contracts, we invest $28,210 over the next 16 days and earn $1,790 ($34,800 – $33,010) or 6.3% (144.8% annualized) if STEC were to remain above $30 or somewhat less – but still profitable – if it were to fall from there to $28.21 ($33.01 – $4.80). In fact, price could fall to $28.63 over the next 16 days, and we would still earn 1.5% (28.8% annualized).
The second strategy (again, selling Puts as soon as the trigger is hit) would sell the $30 Put for $1.00 premium. If price remains above $30, we invest $29,000 to earn $1,000 (3.4%) over the next 16 days. Since price was then at $33.01, we had 12.1% downside protection. In this instance, price could fall to $29.56 over the next 16 days, and we would still earn 1.5%.
The Call strategy again returns more and risks less, but the Put strategy became profitable faster as price made its $2 run higher and offered an immediate profit by closing the position with 50 to 80% of the gain.
During the earnings season, sell offs of quality stocks offer high return opportunities to deploy cash.
Richard Miller, Ph.D. – Statistics Professional, is the president of TripleScreenMethod.com and PensacolaProcessOptimizaton.com .


