Bentonville, Ark., Population: 19,736
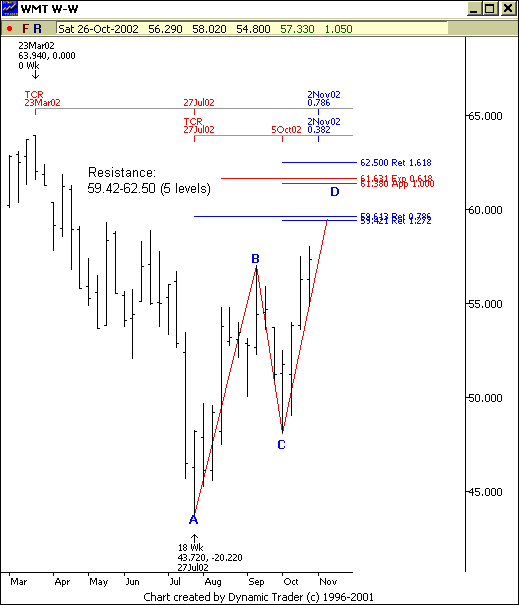
Wal-Mart is in the
process of completing a Bearish Gartley pattern into a large Fibonacci price
resistance zone on the WEEKLY chart. The pattern officially completes at 59.61,
which is the .786 retracement of the March 23 week-ending high and the July 27
week-ending low. I also have a couple of time cycles that are kicking in for
the end of next week. What does this mean?
Short Term:
I would anticipate this
Pattern and Fibonacci price resistance zone will act as a magnet on price and
pull it up a couple of points. So, if I’m short-term trading I would focus on
long setups and triggers until we actually bump into this resistance zone.
Longer Term:
Wait for this Bearish Gartley
pattern to complete and for
(
WMT |
Quote |
Chart |
News |
PowerRating) to hit our Fibonnacci resistance zone.
When that occurs, look for opportunities to short WMT. Personally, if I get a
trigger to short within this zone I will place an initial stop loss just above
62.50. If I don’t get a trigger and WMT clears our resistance zone, then this
stock is poised to clear the March 2002 highs and I’ll have to shift gears.

Oh yeah, Bentonville is
the corporate headquarters of Wal-Mart. Talk about a booming metropolis.
Have a great weekend!
