Beware These Bounces: Four Bearish Bets for Traders
A bounce in a market is defined as much by the movement upward as it is by the inevitable movement back downward.
This is what keeps savvy traders on the sidelines when stocks that have been battered and beaten up suddenly bound higher as if shot from a cannon. While weak stocks that remain weak are of little to no interest to the short-term trader, weak stocks that show surprising or atypical strength are very much the kinds of stocks that traders tend to spend time with. But not as potential longs. Stocks that show strength in the midst of weakness are stocks, in general, to be sold, not bought.
It is an old idea, to buy weakness and sell strength. But it is also an idea that itself has been battered and bruised in recent years. Part of the explanation behind the general abandonment of the “buy low, sell high” mantra that ruled investing and trading for so many years lies in the momentum markets of the 1990s where traders, particularly in the short-term, were able to actually “buy high and sell higher” quite profitably.
But another part of the explanation has to do with the psychology that makes trading such a difficult endeavor. When stocks are rising, we tend to believe they will keep on rising. And the more stocks advance, the more bullish we as traders become.
Of course, at the same time, the more stocks advance, the more likely they are to correct. And the longer that advance continues without a correction or meaningful pullback, the greater, the more severe, the move downward will be when it comes.
The same sort of thing happens with falling stocks. And because we expect falling stocks, generally speaking, to continue falling, it often catches a trader by surprise when one of these falling stocks stops falling and moves higher, “bounces”, suggesting that its days of moving downward are in the past.
Our research suggests that these bounces are not to be believed in or bought. Over time, the edge is actually against the trader who attempts to profit by buying stocks that are weak (for example, trading below their 200-day moving average) and showing temporary strength. The trader looking to buy would actually be better off buying a stock that was generally strong (such as trading above its 200-day moving average) and experiencing short-term weakness.
Click here
to read more about our research into stocks showing temporary strength in a context of weakness.
We have developed an indicator for short-term traders that takes advantage of the findings of this research. Specifically, our indicator
— which can be found at the TradingMarkets
Stock Indicators page — looks for stocks that are trading below their 200-day moving average, but are up 10% or more. Our research has found that these stocks tend to be lower in one-day, two-day and one-week timeframes, making them potential candidates for traders looking to sell stocks short.
The list below includes four stocks that are both under their 200-day moving average, and are up 10% or more as of the most recent close. I am putting these stocks in order of how high their RSI (Relative Strength Index) values are
— the RSI being a key indicator determining whether stocks are overbought and vulnerable to selling pressure, or oversold and vulnerable to buying pressure.
I have also noted the 100-day historical volatility of each stock.
For short-term traders, higher volatility is often a factor in helping determine which stocks are likely to have the price variability that will allow for significant price movement.
IHOP Corporation
(
IHP |
Quote |
Chart |
News |
PowerRating) PowerRating: 1. RSI:
97.56 100-day H.V. 48.49

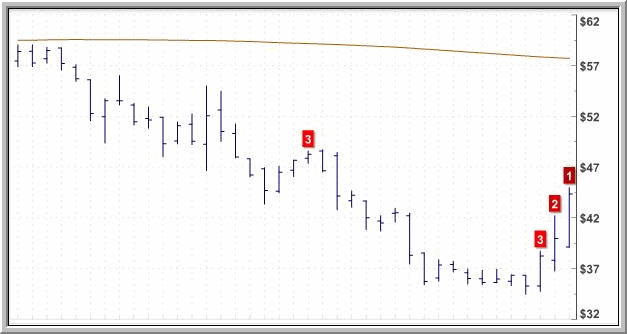
Note how the PowerRating for IHOP, for one example, has gotten lower each of the past three days as the stock has bounced off its lows. The near horizontal line near the $57 level is the 200-day moving average and IHOP’s location below that level is what tells us that the stock is a weak stock and its bounce not to be believed.
Intermune Corporation
(
ITMN |
Quote |
Chart |
News |
PowerRating). PowerRating:
2. RSI: 97.51. 100-day H.V. 61.47
First Bancorp Holding
(
FBP |
Quote |
Chart |
News |
PowerRating). PowerRating: 2.
RSI: 89.25. 100-day H.V. 63.17
Centerplate
(
CVP |
Quote |
Chart |
News |
PowerRating). PowerRating: 2. RSI:
74.59. 100-day H.V. 66.72
PowerRating Charts
are now live!
Click here to launch them.
