Candlestick Trading: The Basics of Bearish Engulfing Patterns, Part 1
Introduction:
Twenty years of trading experience has taught me that making money in the market involves knowing what to trade, knowing when to trade, and having an ability to vary your trading style and techniques to match different market conditions. Successful traders have carefully analyzed a number of different trading systems so they have more than one tool to use. They also know the best market conditions in which to use each tool, and how to vary holding periods and positions sizes in different types of markets.
One way to understand how different trading tools behave in various market conditions is through backtesting. Backtesting does not guarantee that a system will work in the future. However, I would much rather be using a system that has shown reliable results in the past than one that has not. Backtesting also makes it clear that trading is a statistical business. Failing to understand the statistical nature of trading often leads to frustration and losses.
Some traders never really get going because they are always looking for ‘one more indication’ that a trade will be successful. Other traders are using a system because a friend or a book showed them five examples of how it found profitable trades, and they just cannot understand why it is not ‘working for them now’. Now matter what those advertisements we all get in the mail say, there is no magic indicator that shows you whether or not any specific trade will be profitable.
Trading is a Statistical Business:
There are trading techniques that produce a certain percentage of winning trades in a given market condition. Traders that have not analyzed how their trading tools perform in different market conditions have no way of knowing if they are getting the expected results or not. They tend to think they made a smart trade when profits are generated and that they are having a ‘run of bad luck’ when a few trades generate losses. Neither of these thoughts is correct. An example will help make this point.
Imagine thirty two traders in a room, and half decide to go long a stock and half decide to go short. After a few days sixteen traders have profitable positions and sixteen have losing positions. Next, half of the sixteen traders with winning trades go long another stock and half go short. In a few days eight traders have had two winning trades in a row. Half of these traders then go long a stock and half go short, in a few days four traders have picked three winning trades in a row. Continuing this process two more times will result in one trader having five winning trades in a row.
At a trading conference the guy in the above example who picked five winning trades in a row is called brilliant, and sought out for his opinion on trading techniques. People think he has the special gift or insight, and they want to learn how he does it. Professional traders realize that every time this game is played one person will end up picking five winning trades in a row. He does not have any special knowledge or technique; it is just the way the math works.
Trading is more complicated than the simple example above for obvious reasons, but when you run a back test on a trading system you find that there is a win/loss percentage associated with the results. Different trading systems have different win/loss percentages, and these percentages vary by market condition and exit strategy. Backtesting, seeing the results of thousands of trades, makes it clear that trading is a statistical business. There is no way you can consistently predict which specific trades will be profitable, but you can get a pretty good idea of how a specific trading system might behave over the long run.
Fortunately, we do not need to know which specific trades will be profitable; we just need to know how often a given trading technique can be expected to win in different market conditions, and the relative sizes of the average winning and losing trades. If a trading system wins more often that it loses, and the average winning trade gains more than the average losing trade loses, then over the long run the trader using it can do well; given proper money management techniques.
Backtesting also can provide information on how different filters, market conditions, volume patterns, etc affect the results of a given trading system. Trading without a full understanding of how a given trading system behaves is gambling. Having different trading tools for market up trends, down trends, and trading ranges, allows the trader to select the best tool for the current market conditions and is part of a process I call Market Adaptive Trading. You can find out more information on how I adapt to market conditions at daisydogger.com.
The process of developing and understanding a trading system takes time and effort. Trading without making this effort may make money in strong markets, where many different approaches work. In weak markets, or trading range markets, trading a ‘system’ you do not fully understand is likely to end up being expensive. Successful trading starts with research to develop a set of effective tools, writing out a plan so it is clear which tools to use when the market moves through key areas, and then executing the plan. Skipping the work involved in researching tools or writing down the trading plan will increase risks and eventually transfer your money to others taking a more professional approach to the markets.
The Bearish Engulfing Pattern:
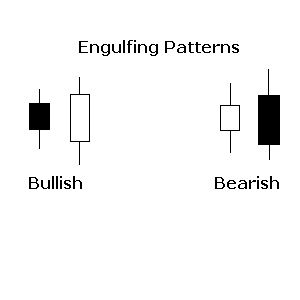
In order to provide a brief overview of how trading systems are developed and analyzed we will examine the well known Bearish Engulfing pattern. As shown in figure 1.01 the Bearish Engulfing pattern is a two bar candlestick pattern. A Bearish Engulfing pattern may mark the end of a stock’s up trend, and if it does traders who short the pattern will profit. The first day of this two day pattern shows a white body indicating that the stock was still moving up. The second day of the pattern has a black body that completely covers or engulfs the body of the pervious day. Because the second day is a black candle, at some point during the day the sentiment reversed and the price started declining, which may signal a further decline in the short term.

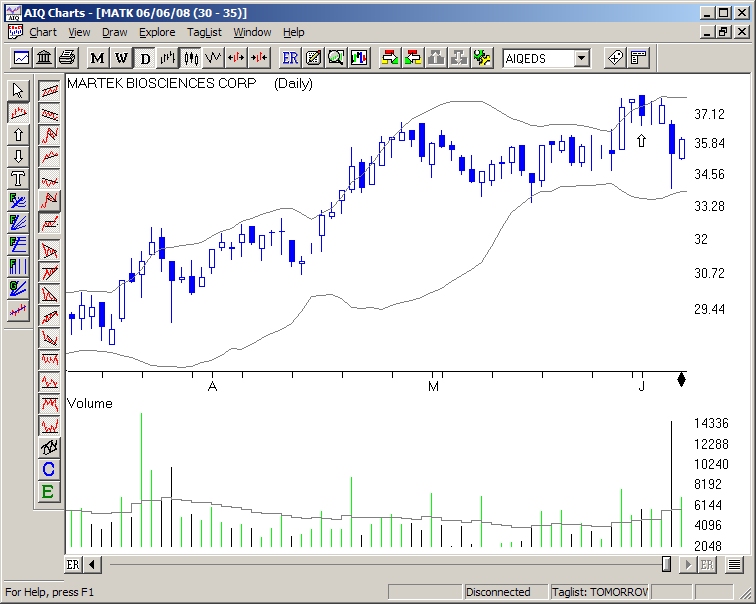
Figure Two shows a bearish engulfing pattern that occurred in MATK on 06/02/08, the second day of the pattern is market by an up arrow. The formation of the bearish engulfing pattern market the end of the up trend for MATK and the stock dropped about ten percent over the next three days. Traders who shorted the bearish engulfing pattern would have seen a nice profit.

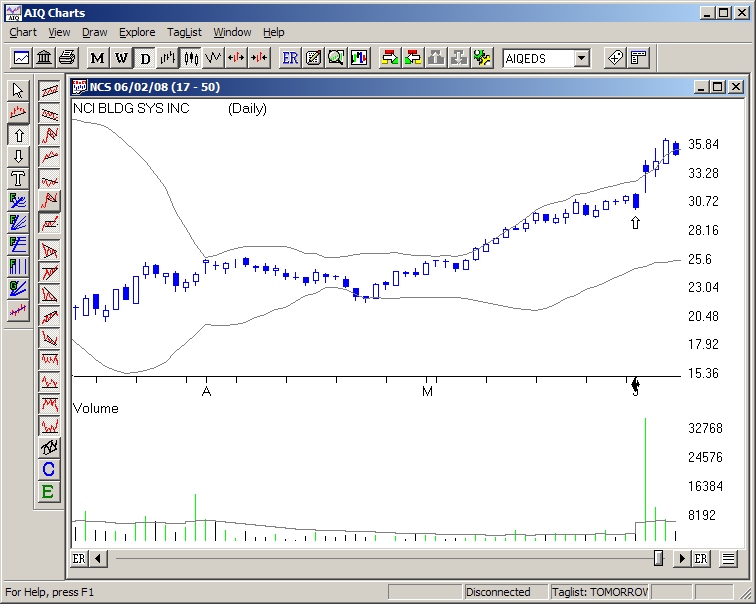
It would be nice if the bearish engulfing pattern worked all the time. Unfortunately, nothing works all the time in trading. Sometimes the stock continues the uptrend after the formation of a bearish engulfing pattern as shown in Figure three. Traders entering short positions on the formation of the pattern would have experienced losses. Trading is a statistical business, not every pattern results in a profitable trade. One of the tricks to trading is to find patterns that win more often than they lose.

Some traders will read about a trading pattern and see half a dozen examples of where it worked and then start trading it. Successful traders will read about a trading pattern and then test it to see how often it works. A few examples mean nothing; it is a lot more interesting to see the results of hundreds of trades, not just a few. This is where backtesting comes in. The trader must understand how often the pattern produces a profitable result; and the effects of various parameters such as volume, price level, average volume, and the effects of varying different parameters involved in the definition of the pattern.
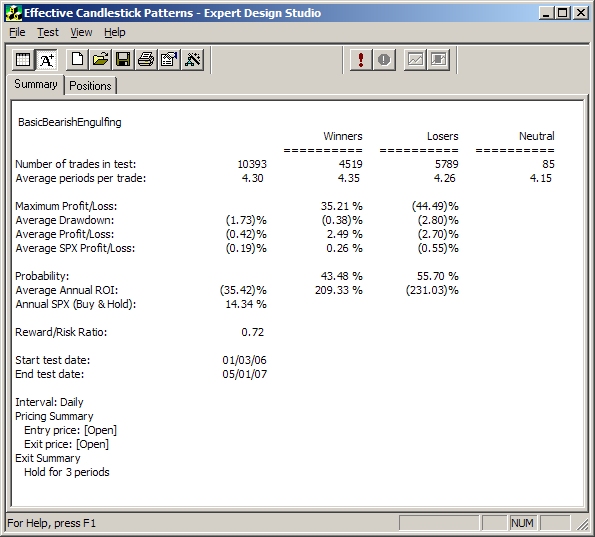
Figure 4. shows the results of testing the Bearish Engulfing pattern during the period of 01/03/06 to 05/01/07. The results show that during this period the pattern not only performed worse than buy and hold, it actually lost money. In fact, losing trades occurred more than fifty five percent of the time and less than forty four percent of the trades during this period resulted in a profit. The initial backtesting results raise a caution flag in regards to trading this pattern. Traders who use this pattern without further analysis may be disappointed.

Steve Palmquist is a full time trader who invests his own money in the market every day. He has shared trading techniques and systems at seminars across the country; presented at the Traders Expo, and published articles in Stocks & Commodities, Active Trader, The Opening Bell, and Working Money. Steve provides additional information for traders at www.daisydogger.com and is the publisher of the Timely Trades Letter.
