Clarifying The Long-Term Outlook Using Candlestick Charts
If
you have a bird’s-eye view, you won’t be afraid of getting lost in
the woods. All you have to do is fly up, look around, and immediately you know
where you are. Many shopping malls have directories in map form, so you can
quickly locate exactly where you are standing. In other words, a bigger picture
can be a great help in focusing on your destination.Â
Many traders make similar mistakes. Often, they are so busy looking for
daytrading opportunities that they become trapped in short-term frames such as
three- and five-minute charts. A five-minute bar chart may help a trader spot
the immediate direction of the market, but it is useless in detecting the
dominant trend of the market.Â
If you are a scalper, you need only three- or five-minute bar charts because you
do not hold stocks for more than a few minutes. But if you hold stocks for more
than an hour, you must arm yourself with longer-time-frame charts such as daily
and weekly, in addition to your own time-frame charts. Longer-time-frame charts
reveal important resistance and support levels, so you won’t be caught in sudden
reversals. In this lesson, I would like to show you how longer-time-frame
candlestick charts can help to clarify the long-term outlook of stocks.
As we know, some Internet stocks have been making a fierce comeback lately. For
instance, Amazon
(
AMZN |
Quote |
Chart |
News |
PowerRating)] was trading slightly above $8 at the beginning of
April, but its value today (5/4/01) is $17.56 a share, more than double. The
obvious question is: Can Amazon continue this upward momentum?
Let’s look at different
time-frame candlestick charts, and see what kind of insights we can gain from
them.Â
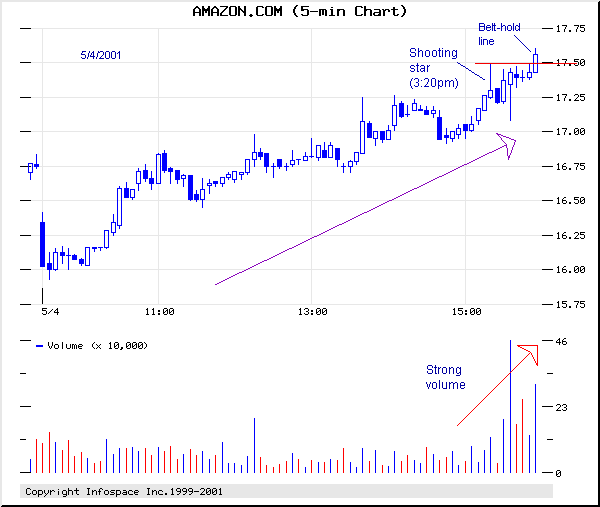
Below you see a five-minute chart of Amazon from 5/4/01. We can’t detect any
weakness at all. Even the bearish shooting star that appeared at 3:20p.m. was
negated by a strong belt-hold line (opens near the low, but ends near the high)
at the closing. Look how heavy transaction volume was in the last 30 minutes of
trading. What’s your forecast? I’m sure that after studying this chart, nobody
would be planning to short the stock.

Now,
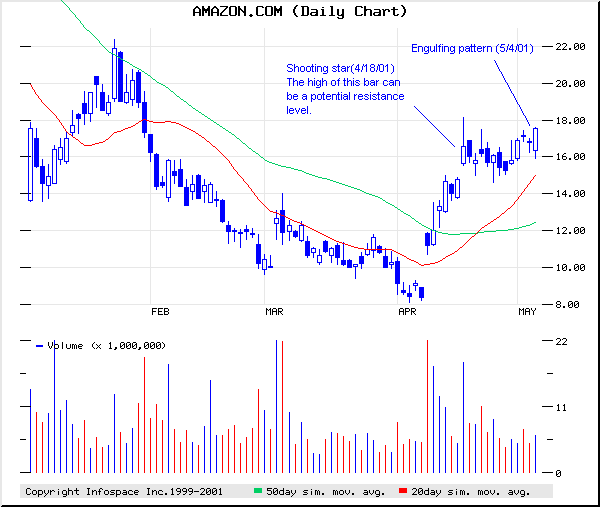
let me give you a different picture by showing you a daily chart of Amazon. It
doesn’t look as bullish as the five-minute chart above, does it? The stock
managed to break out above its 50-day moving average on April 12, and on April
18, it formed a bearish shooting star (a long upper tail with a small real
body). Often, the high of the shooting star becomes a resistance level. With
that in mind, I want you to look at the daily chart again. The stock is now
challenging the high of the shooting star. Can it take out the high? Some
candlestick chartists are betting on a breakout because the issue formed a
bullish engulfing pattern (a real body totally engulfs the previous day’s real
body) on 5/4/01. Anyway, watch out for a potential breakout or breakout failure.

The next
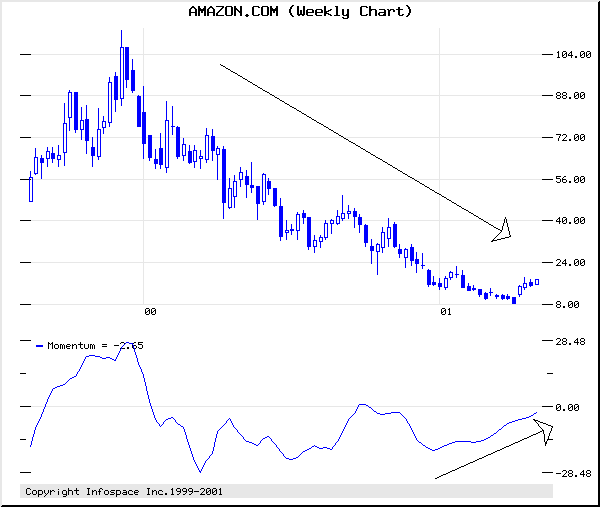
natural step is to study Amazon’s weekly chart. Can you convince me to buy the
stock after glancing at this chart? The only thing I can say is: Amazon is
pulling back from its April low. I don’t see any candlestick patterns indicating
imminent major bullish reversals. If I’m allowed to use a momentum indicator, it
may be signaling a minor rally. Even though the stock is declining, the momentum
indicator is rising. It is telling us the intensity of price decline is
weakening, but I don’t want to give too much credit to one indicator.Â

The
long-term trend of Amazon is still down, as its weekly chart reveals, but daily
and five-minute charts indicate tradable patterns. If you use the five-minute
chart only, you are in danger of becoming too bullish on the stock. After
studying the daily chart,
you become cautious because the stock is facing its resistance level. By adding
weekly charts to your toolbox, you may even look for potential short
opportunities. The lesson here is loud and clear. Don’t trap yourself into one
time frame alone. Remember, successful traders have a bird’s-eye view of the
market.
Good luck and happy trading.
For The Best Trading
Books, Video Courses and Software To Improve Your Trading
