Cointegration is not the same as correlation
A reader asked me recently why I believe that energy stock
prices (e.g. XLE) are correlated with crude oil futures front-month contract
(QM). Actually I don’t believe they are necessarily correlated. I only think
they are “cointegrated”.
Click here to order your copy of The VXX Trend Following Strategy today and be one of the very first traders to utilize these unique strategies. This guidebook will make you a better, more powerful trader.
What is the difference between correlation and cointegration? If XLE and QM were
really correlated, when XLE goes up one day, QM would likely go up also on the
same day, and vice versa. Their daily (or weekly, or monthly) returns would have
risen or fallen in synchrony. But that’s not what my analysis was about. I claim
that XLE and QM are cointegrated, meaning that the two price series cannot
wander off in opposite directions for very long without coming back to a mean
distance eventually. But it doesn’t mean that on a daily basis the two prices
have to move in synchrony at all.
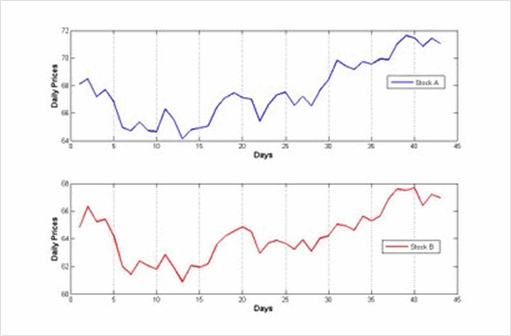
Two hypothetical graphs illustrate the differences. In the first graph, stock A
and stock B are correlated. You can see that their prices move in the same
direction almost everyday.
Now consider stock A and stock C.
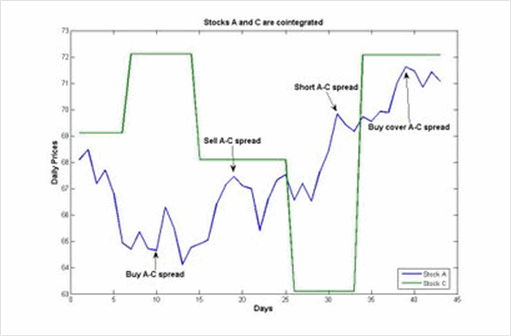
Stock C clearly doesn’t move in any correlated fashion with
stock A: some days they move in same direction, other days opposite. Most days
stock C doesn’t move at all! But notice that the spread in stock prices between
C and A always return to about $1 after a while. This is a manifestation of
cointegration between A and C. In this instance, a profitable trade would be to
buy A and short C at around day 10, then exit both positions at around day 19.
Another profitable trade would be to buy C and short A at around day 31, then
closing out the positions around day 40.
Cointegration is the foundation upon which pair trading (statistical
arbitrage) is built. If two stocks simply move in a correlated manner, there
may never be any widening of the spread. Without a temporary widening of the
spread in either direction, there is no opportunity to short (or buy) the
spread, and no reason to expect the spread to revert to the mean either.
For further reading:
Alexander, Carol (2001).
Market Models: A Guide to Financial Data Analysis. John Wiley & Sons.
Ernest Chan, Ph.D. is a quantitative trader and consultant who helps his clients
implement automated, statistical trading strategies. He can be reached through
www.epchan.com. Ernie has worked as a
quantitative researcher and trader in various investment banks (Morgan Stanley,
Credit Suisse First Boston, Maple Securities) and hedge funds (Mapleridge
Capital, Millennium Partners, MANE Fund Management) since 1996. He has a Ph.D.
in physics from Cornell University.