Connors Research Traders Journal (Volume 54): Increasing Your Edges With The 4-Period RSI
In two of the strategies presented in our new book, The Alpha Formula: Beat the Market with Less Risk, we utilized the popular technical indicator RSI or Relative Strength Index.
Connors Research has been at the forefront of RSI research for decades. We’ve clearly shown that shorter period RSI’s, such as a 2-period or 4-period RSI, are a superior way to identify mean-reversion opportunities compared to the standard setting of 14 days. This original research was published in 2002 by us and we’ve continued to update the test results ever since.
RSI’s with short lookbacks are effective in signaling that a security has moved “too far too fast”, and is due for a move back to the mean. This is especially true in equity and equity ETFs that are oversold. RSI remains, based on data, the best way to measure a pullback both on a daily basis and a weekly basis.
In this issue of the Connors Research Traders Journal, we will take a closer look at the historical performance of two popular ETFs, SPY, and QQQ, given different RSI readings.
Studying these historical edges will advance your RSI knowledge, ultimately giving you more confidence in executing your trades and leading to greater profitability.
There Has Consistently Been Clear Historical Edges At Low RSI Levels!
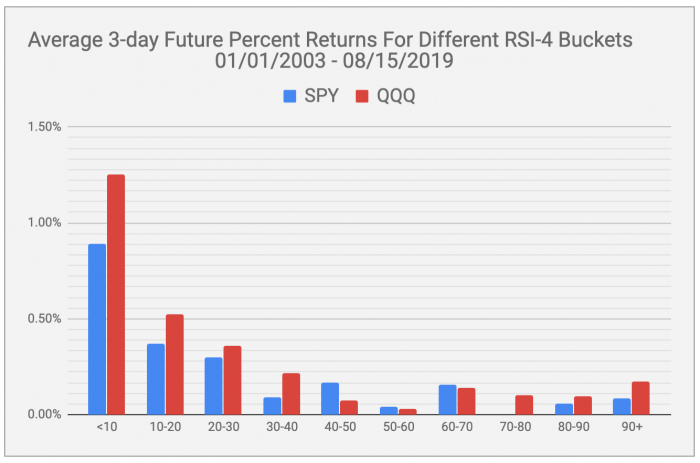
To investigate this further, we are going to present research showing the historical edges for short period RSIs at different levels. In this simple study, we’ll explore the average future three-day percentage changes given different RSI readings.
The time period covered in this study is January 1, 2003 to August 15, 2019. We will explore the average 3-day percent change for each ETF for all days. We will then compare this to the average 3-day future percent changes given different RSI levels.
The lookback we will use here is a 4-period RSI. Prices used for these calculations are total returns, adjusted for splits and dividends.
A clear trend emerges when inspecting the results:
- The average 3-day future returns of the whole sample was 0.12% for SPY and 0.17% for QQQ covering 4,177 trading days.
- Lower 4-period RSI values leading to higher 3-day future returns and higher RSI values lead to lower 3-day future returns.
- For example, the average three-day future percent change for SPY on days when its 4 period RSI was below 10 (46 trading days) was 0.89%, significantly higher than the 0.12% observed for all days. The results were even more dramatic with QQQ, with 4-period RSI readings below 10 leading to an average increase of 1.25% over the next 3 days.
- Any RSI reading below 30 for both securities lead to above-average future 3-day returns.
- By contrast, notice the lower than average future returns given high RSI values. RSI values of 70-80 in SPY, for example, occurred in 688 trading days and lead to a future percent return of -0.02%, well below the average for the whole sample. A similar pattern emerges with QQQ, with any 4-period RSI reading about 70 leading to lower than average returns.
Successful modeling of trading strategies are built on inherent edges. We’ve seen this since 2002; lower RSI readings in equities have consistently led to higher short-term returns versus higher RSI readings.
Increasing The Edges Further
We know these edge can be improved on with dynamic exits. Exits using higher RSI readings or closing prices crossing above various short-term moving average lengths often increase the edges further and we encourage you to pursue these types of exit strategies.
Edges can also be expanded by applying trend filters and intra-day pullbacks. We teach this in the first session of our Swing Trading College, a highly popular course we’ve been teaching for over 15 years (you can find details below).
Conclusion
In this issue, we quantitatively identified historical edges in the form of future 3-day returns, given different RSI levels. This results in a clear pattern – lower RSI readings have lead to higher future returns and higher RSI reading have lead to lower than average future returns.
Seeing the data presented like this increases confidence in the method and should lead you to strong convictions when executing trades, with the goal of leading to higher profits.
More Knowledge From Connors Research To Improve Your Trading
1. Programming In Python For Traders
There Is No Future For Traders Who Don’t Know Python
efinancialcareers.com
Become a Stronger and Smarter Trader in Only 5 Weeks!
The majority of the professional trading desks around the world are requiring their traders to create and test their strategies using Python (not Amibroker and TradeStation). They’re doing this because Python allows their traders to build better strategies faster and more efficiently with the objective of increasing profits.
If you would like to learn more about how you can join the tens of thousands of professional traders now using Python, please listen to this 30-minute webinar we have just conducted.
This webinar discusses how and why Python will improve your trading. It also discusses our upcoming Programming in Python for Traders course and how you can be a part of it.
This is the third time we’re offering the course and it’s already the largest class to date with many professional traders registering for the course.
We also guarantee your programming success with a full money-back guarantee – you’ll be programming in Python within 6 hours or you receive a full refund.
2. Become a Master Swing Trader in 10 Weeks… click here for more information
The passive investment industry states there is no Alpha in the markets. This book proves them wrong!
The Alpha Formula – High Powered Strategies to Beat The Market With Less Risk teaches you strategies and portfolios with historical Alpha in Stocks, ETFs, and Fixed Income.
Backed by dozens of academic studies and combining behavioral finance with Ray Dalio’s correlation research, this book will teach you new, easy to understand quant strategies you can apply immediately.