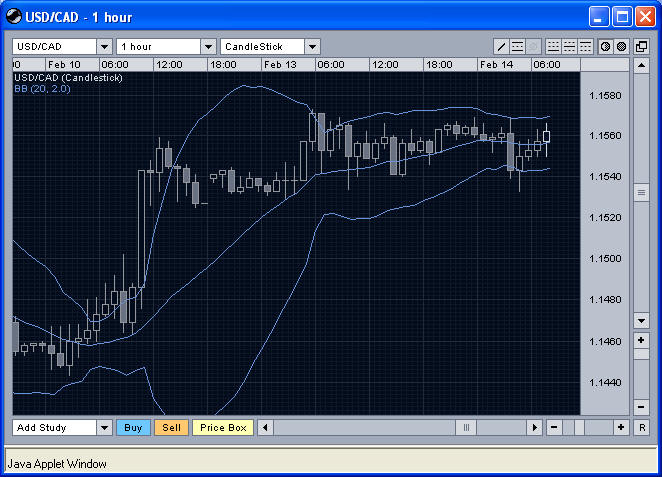
Details on an unfolding USD/CAD rally
This week has started
off in rather ho-hum fashion for USD/CAD. As can be seen in the
hourly chart below, the market has essentially been moving sideways,
consolidating last Friday’s run up. Something is going to give soon, of
course. It’s just a matter of which way.
If we switch our focus to the daily chart,
we can get an idea of the prospects. Although USD/CAD has been in a prolonged
downtrend for some time now, there is yet the potential for more upside in what
has become a decent rally off the most recent lows.
The thing to focus on right now is how Friday’s
surge put the market through the 20-day moving average (middle Bollinger Band
line) and Monday’s action sustained those gains, even adding to them. So far
today there has been a minor probe downward, but nothing with any force or
conviction, and it was quickly reversed. This puts the market in a good
position to continue the recent upswing.
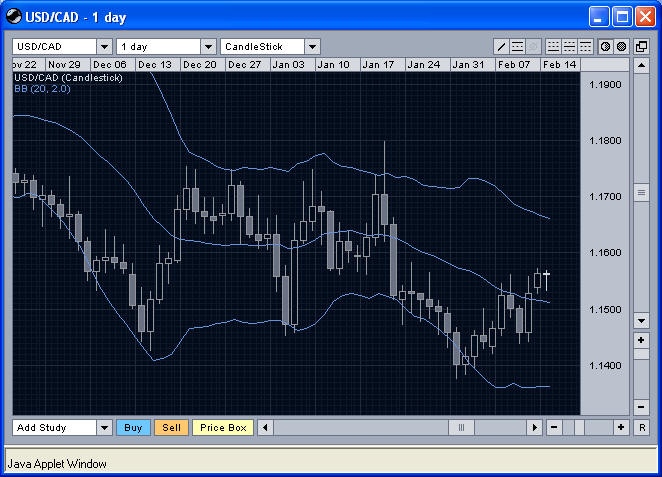
Given the overall negative bias in USD/CAD from
the longer term perspective, it is hard to see the upside on a rally from here
as being overly large A break through the upper part of the hourly chart range
would face two points of resistance. The first is the upper daily Bollinger
Band currently in the 1.1660 area. If that were to be breached, then the 1.1700
area becomes a major hurdle. That is the area of several peaks from the last
major consolidation period. Even still, the nimble swing trader could make a
nice quick gain.
John Forman is a near 20-year veteran of
trading and investing across a wide array of markets and instruments. He is
author of the forthcoming book,
The Essentials of Trading (Wiley, April 2006) and is currently working on a
new book – Trading With Fire. His
analysis and market comments have been found in the financial news media across
the world and he has published dozens of magazine articles on trading
methodology and analytic technique. To learn more about John’s research and
trading activities, visit the Anduril
Analytics website.