E-Mini Trading Levels And Volatility
Here’s
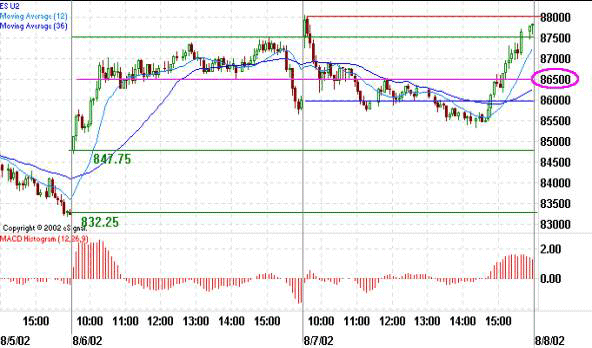
a look at Wednesday’s ESU2 action
on a five minute, multi-day chart:

This
chart could not be following the 5’s and decade numbers any better!Â
Never ignore the psychology of these levels!Â
865 was a huge level to break up above.Â
Take a second also to note how key 855, 860 and 870 were to Wednesday’s
price range. Thursday we’ll most
likely see a pop above the current resistance of 880.Â
Watch for 883-885 to be initial resistance after which we will see
890-892 as the next obstacle.
 
You
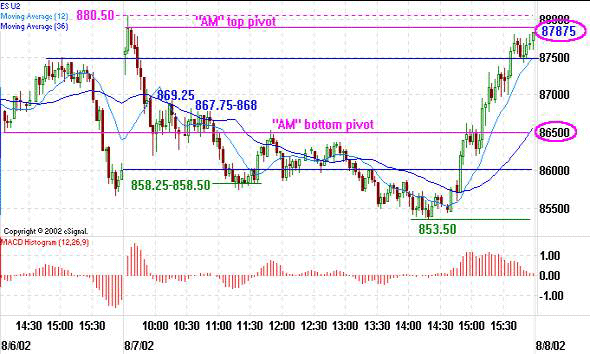
can see the “AM†pivots here on Wednesday’s three minute ESU2.Â
You will also notice that on candles that have “long†wicks I will
usually rely on the candle body for my pivot level, especially when the level is
a multi-day support or resistance level as 865 was…the “AM†top pivot
could have been either the 878.75 level or 880.50. Â
Think up multiple “AM†pivots (when they occur) as aggressive vs.
conservative trading levels. I
marked the 867.75-868 and the 869.25 level as a potential stop loss levels
because the short below the bottom pivot could have been taken before 10:54
because of the long wicks of many of the candles.Â
Hey! It
happens…The gap close level at 860 (and a decade number) could be
used as an initial profit target. From
here, the 865 level goes on to become a significant resistance level.

A
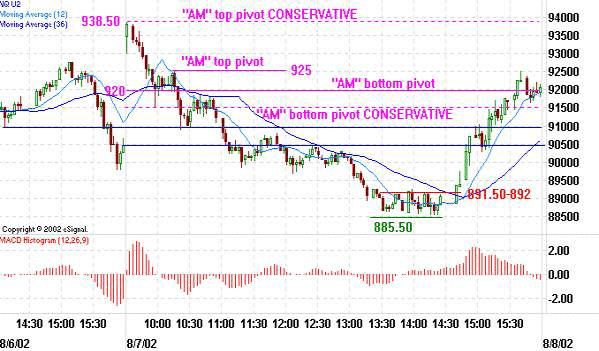
look at the NQU2 shows us a great example of conservative pivots when they do
occur:

With
the conservative “AM†pivots
marked on the NQU2 chart, you can see the different trading levels at
which you could be making decisions. Initial
resistance for Thursday’s open will be between 930-938.50.  Â
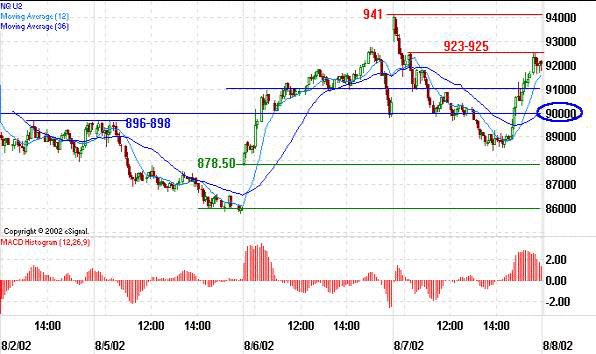
If you look at the NQU2 10×10 (ten day, ten minute chart) you will see
multi-day resistance is waiting between 930 and 940.Â
Remember the 939 gap close level from 7/29.Â
Questions?
Â
Â
