ETFs that Track Quantitative Indexes are Definitely Worth a Look
Many of the newest exchange-traded funds (ETFs) are supercharged by
rules-based, quantitative algorithms, offering the potential for market-beating
returns- plus a number of other advantages over both traditional mutual funds and
market-cap-weighted ETFs. Looking to make a directional bet on a market, sector,
or niche? Looking to hedge a portfolio? Rather than following the herd and
sticking with the traditional investment vehicles, a quant-based enhanced
ETF promises a higher octane play.
A Primer on ETFs
An ETF is a portfolio of securities that trades like an individual stock on a
major stock exchange and can be bought or sold throughout the trading day. It is
constructed to:
(1) track the holdings and performance of a defined “index” of securities,
and
(2) enable investors to cost-efficiently purchase such an index as a single
basket of securities.
They offer the professional management and diversification you expect with a
fund, and they are listed on a stock exchange with a ticker symbol so you can
buy and sell them just like a stock. ETFs also offer a wide range of investing
opportunities.

The underlying index of an ETF generally represents a broad market, market
sector, industry, niche, geographical region, or theme-based specialty area.
Some of the more well-known equity-focused ETFs include the ^QQQQ^, which tracks the Nasdaq 100 Index, and ^SPY^, which tracks the S&P 500 Index.
The ETF that tracks the ^IWV^ accounts for roughly
98% of the total value of all equity traded on U.S. stock exchanges. It would be
quite a task for an investor to buy such a large basket of securities to track
this index on his own- but the ETF makes it easy.
Examples of theme-based specialty ETFs include the ^PHO^ or the ^DEF^.
There are also ETFs that track things like private equity, spin-offs,
intellectual property, neglected stocks, and nanotechnology.
Some are designed for hedging or betting against major market indexes. One
example is the ^QID^, which is a “double inverse”
play on the NASDAQ 100.
Keep in mind, an ETF doesn’t have to track stocks. It can track virtually any
kind of investment, including bonds, bulk commodities, or futures contracts.
Examples include the ^TLT^, the ^GLD^, and the ^USO^.
GLD and USO track the price of gold and oil, respectively – GLD actually holds
gold bullion, while USO trades oil futures contracts. In fact, pick an asset
class that is publicly available and there is a good bet that it is represented
by an ETF… or will be soon.

Although exchange-traded funds (ETFs) have been around since the early 1990s,
their popularity has soared in recent years, attracting a myriad of new product
offerings. According to the Investment Company Institute, the combined assets of
U.S. exchange-traded funds ETFs) at the end of 2007 exceeded $600 billion,
reflecting a 40% year over year increase. And with over 600 ETFs trading in the
U.S., choices are aplenty. Although none of the current ETFs are considered to
be actively managed, PowerShares recently received approval from the SEC to
issue the first actively managed ETFs, but they still will have trading
limitations relative to mutual funds.
Enhanced indexing promises out-performance
Traditionally, indexes were designed to simply track the average performance
of a group of stocks that represented either a broad market or a specific
segment of the market. Indexes were also developed to serve as benchmarks for
assessing the performance of an active portfolio manager. Such traditional
indexes typically weight stocks based solely upon their market capitalization.
However, as markets rise, cap-weighted indexes continually overweight larger,
potentially overvalued (“growth”) stocks while underweighting smaller,
potentially undervalued (“value”) stocks, which skewed the indexes toward a more
speculative growth (or even “bubble”) orientation.
Thus, enhanced (a.k.a., dynamic or active) indexing has
gained favor. The goal is to identify a subset of stocks from within a
traditional broad-based index that exhibit certain key characteristics,
providing the greatest potential for capital appreciation. Such an approach
provides the potential to generate higher long-term returns, and perhaps even
reduce volatility, compared with market-cap-weighted indexes. And for some the
goal might be efficient asset allocation or risk containment (such as country or
sector risk).
The first level of enhanced indexing is to employ standard fundamental
factors used by research analysts for evaluating a company- such as book value,
cash flow, earnings, and dividends- to determine how much weight the stock should
represent within an index. For the most part, this approach seeks
out-performance by increasing the beta of the portfolio, primarily by increasing
exposure to smaller caps and value.
One example is the ^PRF^,
which applies a fundamental weighting approach to the 1,000 largest U.S.
equities. The index provider, Research Affiliates LLC of Pasadena, CA, has
become widely known for its fundamental indexing. Chairman Robert Arnott has
observed that equally weighting a given index of stocks historically adds about
180 bps/yr of return versus market cap weighting, and fundamental weighting
tacks on an additional 80 bps/yr above equal weighting.
Quantitative indexing ups the ante
The second level of enhanced indexing is to employ a wider variety of
factors, including fundamental, technical, and sentiment-oriented (e.g., insider
buying, put/call options activity, etc.), to select a subset of “top-ranked
stocks” from the given universe. According to David Brown, Chief Market
Strategist for Sabrient Systems LLC of Santa Barbara, CA, this can be
accomplished with a multi-factor, quantitative indexing approach that is
transparent, back-testable, and repeatable. Today, a number of quantitative
firms provide rules-based enhanced indexes that embody their best ideas in
selected market areas.
They typically focus on a smaller number of stocks (e.g., 50-100), are
rebalanced quarterly, and the constituents may change substantially based on the
underlying algorithm’s results. Such an approach seeks alpha rather than
simply gaming beta exposure.
The following table provides a few examples of quant-based ETFs and their
performance versus the S&P 500.

An interesting comparison for the ^PRN^, which employs a multi-factor quant “Intellidex” approach
to select its portfolio, is the ^XLI^,
which tracks the group of stocks in the S&P 500 that are designated to be in the
Industrials sector and is market cap weighted. As of 12/31/2007, PRN was up
20.6% since its inception on 10/12/2006 with a correlation to the S&P
Industrials sector of 0.79, while the fully- correlated XLI was up 14.7% over the
same period.
Now let’s look more closely at the underlying index for the ^NFO^. The ^SBRIN^
applies a quantitative algorithm to select 100 stocks from among a broad
universe of U.S. equities, and weights each of them equally. The index selects
stocks exhibiting notably positive sentiment among corporate insiders and Wall
Street analysts who follow the company.
SEC Form 4 filings indicate the number of key insiders purchasing their
company’s stock on the open market and the magnitude of those purchases.
Thomson’s IBES analyst database provides the number of analysts making positive
revisions to their earnings estimates and the magnitude of those revisions.
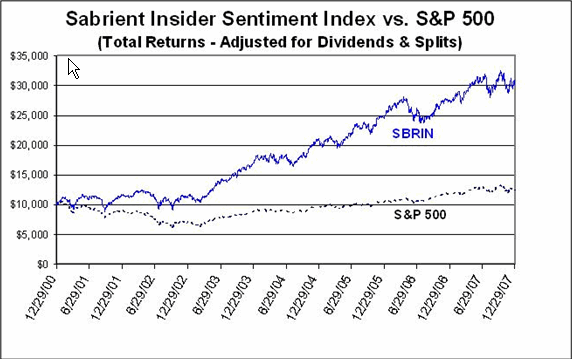
Performance for SBRIN is shown below versus the S&P 500 total return index
over a 7-year period (12/29/2000-9/12/2006 is backtested data, and
9/13/06-12/31/07 is actual published data). Over the given 7-year period, total
return for the S&P 500 was a modest 24% while the quant-enhanced SBRIN returned
a robust 200%
ETFs have proven to be a compelling alternative to traditional mutual funds,
offering a host of advantages. While static indexing provides a way to create
ETFs for general exposure to broad markets or sectors, enhanced indexes based on
quantitative algorithms have greatly expanded the range of choices and offer
real potential for market beating returns and alpha generation.
Scott Martindale is the Senior
Managing Director for Sabrient Systems LLC ( www.Sabrient.com )in Santa Barbara, CA. Sabrient
publishes five quantitative indexes that are tracked by ETFs.