EURGBP Trades Within Its Falling Channel
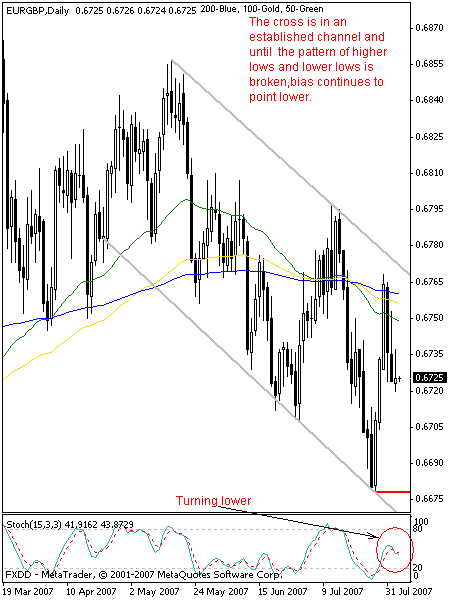
EURGBP continues to trade within its established falling channel rising off
the channel base at 0.6678 the past week but failing to test the channel top at
0.6776 before putting in a two-day of downside weakness on Wednesday. The said
pattern now keeps the short term focus to the downside.
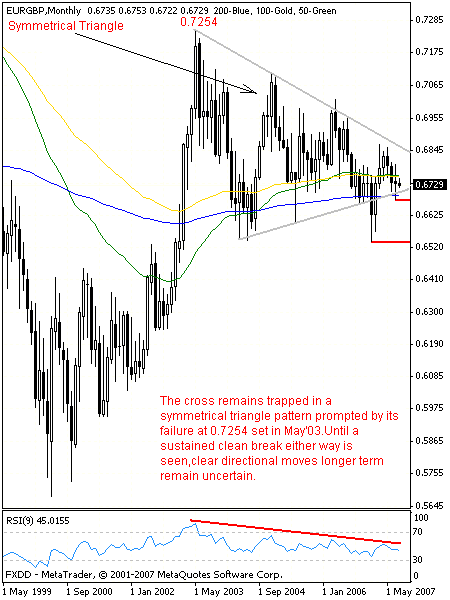
Seen from the bigger picture, EURGBP has been trading in a symmetrical triangle
(weekly chart) since its rally off the Sept’01/Dec’01 lows at 0.6035/65
terminated at 0.7258 in late May’03.The pattern resolved to the downside in
early Jan’07 and remained below there for six weeks until it turned back above
the invalidated pattern to signal a failed break out and a continued range
trading environment in early Feb’07 and of recent last week.
Figure 1: Daily Chart

Although the sideways trading environment is seen as a correction of its
0.6035-0.7258 rally, a clear break and hold either to the downside or upside is
required to create any meaningful medium to longer term directional bias. While
the monthly chart exhibits signs of a possible break out as evidenced by its
contracting ranges, clear directional moves in the long term remains uncertain
as shown by the said triangles on both the weekly and monthly charts.
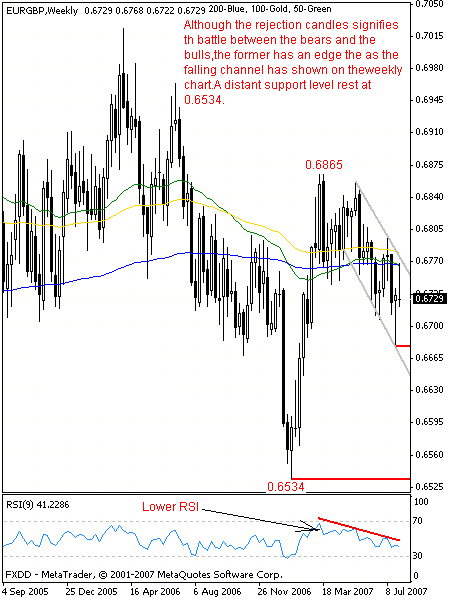
Figure 2: Weekly Chart

While the weekly and monthly charts are indicative of price contraction as shown
by the symmetrical triangle, the short term trend seen on the daily chart is in
a clear downtrend and as long as the bearish structure of lower highs and lower
lows within the falling channel remains intact, odds are for the cross to post
lower prices which in this case may tip off the likely direction of the triangle
break.
Figure 3: Monthly Chart

Downside targets are seen at the 0.6712/07 levels, its Jun 21/29’07 low and the
0.6678 level, its July 26’07 low. A clean break and close below the latter
improves the outlook for additional lower prices towards its .618 Ret
(0.6534-0.6865 rally)/Oct 29’06 low and then the 0.6534 area, which marks its
weekly swing low set in Jan’07. Both RSI and Stochastics on the daily and weekly
time frames continue to decline and point towards further lower prices.
On the other hand, to put a hold on to its current short term downside bias,
a close above the 0.6768/77 zone, the locations of July 30’07 high/channel top
is required to bring further gains targeting its May 30’07/July 11’07 highs at
0.6797/0.6810 ahead of its 2007 peak at 0.6865 printed in Mar’07.
On the whole, while the short term trend points lower, its medium term trend
remains mixed.
Mohammed Isah is a professional technical market analyst, mentor
and instructor. He initially traded stocks and now primarily focuses on forex.
He was former market analyst at fxinstructor.com and currently he is head of
research and technical strategist at
www.fxtechstrategy.com, a website dedicated to currency research. He can be
contact at: m.isah@fxtechstrategy.com
