Fading Overreactions
Friday
was as expected, with an economic number and the
futures players got wacky. The overreaction or raid, whichever you prefer,
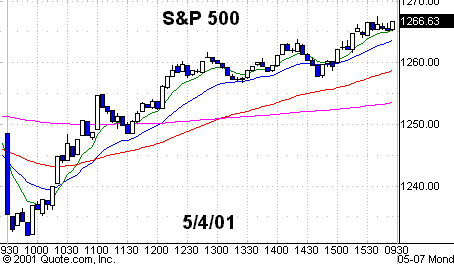
didn’t last more than two bars. The S&P 500
(
SPX |
Quote |
Chart |
News |
PowerRating) traded down 17 points
to a 1232 intraday low by the 9:50 a.m. bar, then had a solid uptrend for the
remainder of the session, closing at 1266.61. The SPYs closed at 127.34 and the
index is once again bumping up against the 127 to 132 resistance area for the
fourth time in the last five days.
Total volume was, once
again, relatively light at 1.08 billion, and institutional blocks at only
19,789. The volume ratio was excellent at 73 and breadth positive at +1081
advancers over decliners.
The Nasdaq 100
(
NDX |
Quote |
Chart |
News |
PowerRating)
opened down 57 points or 3% from the previous close of 1878 as the market makers
had a big pay day thanks to the oh-so-common overreactions. The NDX hit its
intraday low of 1811 on the second bar and then rallied to close at 1923.81.
There were Trap Doors, Volatility Bands, First Consolidation Breakouts to New
Intraday Highs and then some Slim Jims along the way.
The NDX, as represented by
its proxy the
(
QQQ |
Quote |
Chart |
News |
PowerRating)s, gave all of you seminar attendees a pattern entry
above 1822. If you didn’t take it and you were watching the screen, then make
note that your deficiency is not one of knowledge but of emotion or injecting
your ego into the trade. You can correct that, but don’t buy another trading
book or attend seminars until you do. Also, you will find that the Grail is
inside your head, not in a book.
Currently the Nasdaq
Composite and NDX 100 are sitting at 13-bar horizontal consolidation patterns,
the Nasdaq Composite between 2233 and 2000 while the NDX is between 1982 and
1743. The NDX closed at 1923.81 and the Composite at 2191.53. There is also
minor resistance for the Composite at 2252. The 200-day EMA for the Composite is
up at 2697, and for the NDX at 2506.
There were many good trades
Friday in the Travel Range stocks like
(
JNPR |
Quote |
Chart |
News |
PowerRating)
which opened at 57.65, then drew a line for eight bars, before exploding above
58.5 for over 5 points. For those of you who like a more gentle ride,
(
CSCO |
Quote |
Chart |
News |
PowerRating)
was a good choice. It opened at 17.93, hit its intraday low of 1774 on the third
bar vs. its 20-day EMA of 1764, then rallied to a 19.77 high as the Generals
returned. The company reports earnings Tuesday vs. its previous negative warning
and it’s guaranteed that the TV media will create a Super Bowl hype around it.
Stocks
Today
|
(June
|
||
|
Fair Value
|
Buy
|
Sell
|
|
4.15
|
 5.45 |
 2.85Â
|
(
AMGN |
Quote |
Chart |
News |
PowerRating) which is
sitting in a range just below its 200-day moving average;
(
HGSI |
Quote |
Chart |
News |
PowerRating),
(
MLNM |
Quote |
Chart |
News |
PowerRating),
and
(
DNA |
Quote |
Chart |
News |
PowerRating). Also
(
QCOM |
Quote |
Chart |
News |
PowerRating),
(
SEBL |
Quote |
Chart |
News |
PowerRating),
(
VRTS |
Quote |
Chart |
News |
PowerRating) and
(
VRSN |
Quote |
Chart |
News |
PowerRating). Â
In the Semis,
(
BRCM |
Quote |
Chart |
News |
PowerRating),
(
NVLS |
Quote |
Chart |
News |
PowerRating) and
(
IDTI |
Quote |
Chart |
News |
PowerRating).
Other stocks: CSCO of
course (which, as I mentioned, has its earnings tomorrow),
(
FDC |
Quote |
Chart |
News |
PowerRating),
(
EMC |
Quote |
Chart |
News |
PowerRating),
and then in the Financials,
(
PVN |
Quote |
Chart |
News |
PowerRating),
(
COF |
Quote |
Chart |
News |
PowerRating),
(
FITB |
Quote |
Chart |
News |
PowerRating),
(
C |
Quote |
Chart |
News |
PowerRating),
(
LEH |
Quote |
Chart |
News |
PowerRating)
and
(
MWD |
Quote |
Chart |
News |
PowerRating).Â
Also, you might focus on
(
AOL |
Quote |
Chart |
News |
PowerRating)
and in the Energies,
(
ATC |
Quote |
Chart |
News |
PowerRating),
(
CAF |
Quote |
Chart |
News |
PowerRating),
(
RBC |
Quote |
Chart |
News |
PowerRating) and
(
DO |
Quote |
Chart |
News |
PowerRating).
Have a good trading day.

Chart 1. Five-minute chart of
Friday’s S&P 500
(
SPX |
Quote |
Chart |
News |
PowerRating) with 8-,
20-, 60-
and 260-period EMAs.

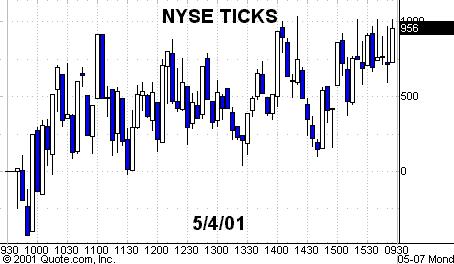
Chart 2. Five-minute
chart of Friday’s New York Stock Exchange ticks.
