Flashing a Warning Sign
After breaking higher last Monday, the market has spent the
last five days in a low-volatility consolidation. Volatility, like price, tends
to be mean reverting. Therefore we may see some bigger moves as the week moves
on. Potential news movers include the FOMC minutes tomorrow, Retail Sales on
Wednesday, or CPI on Friday. I closed out my index short position on Friday
morning for a small gain and am waiting for the market to become extended again
(either up or down) before attempting another trade.
In last Monday’s column I showed a chart that displayed the relative strength of
the NASDAQ vs. the NYSE Composite indices. I received a few questions on this
indicator so I thought I’d revisit the chart and discuss my interpretation of
it.
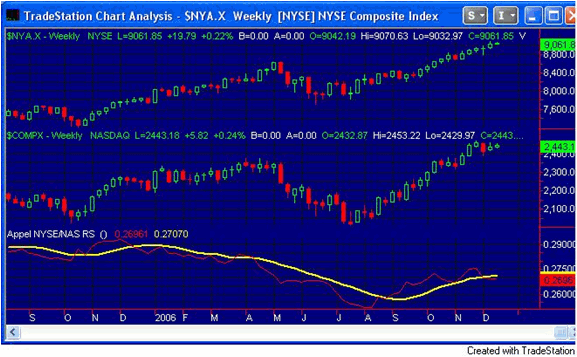
Below is an updated chart as of today (chart is weekly). To review, what the
indicator shows is whether the NASDAQ or NYSE Composite index is leading. If the
red line is above the yellow line, then the NASDAQ is leading. If the red line
is below the yellow line, then the NYSE is leading. For the last couple of weeks
the NASDAQ has lagged.

The indicator is formulated in the following way:
1) A ratio is taken of the NASDAQ to the NYSE. Currently that ratio is about
0.27 as shown in the chart. This ratio is plotted as the red line.
2) A simple ten-week moving average is taken of the above ratio. This is plotted
as the yellow line.
I should note that the indicator is somewhat controversial. People that dismiss
the usefulness of it say that the beta of the NASDAQ is higher than the beta of
the S&P 500. Therefore, in up markets the NASDAQ will tend to go up more and in
down markets it will tend to go down more. The lagging relative strength of the
NASDAQ is the EFFECT of a down market – not the CAUSE. It’s all a function of
beta and therefore not particularly useful.
Proponents of the indicator claim that the types of stocks that make up the
NASDAQ are more speculative in general than those that make up the NYSE
Composite. Since NASDAQ stocks are more speculative, out performance of these
indicate that investors are generally feeling good about market prospects. This
will cause investment dollars to flow into the market and lead to a bullish
environment. When investors are becoming bearish, they will seek out safety and
tend to favor NYSE over NASDAQ stocks. Generally, when they are less optimistic
about the market, less dollars will flow in and the market will struggle to
advance and perhaps even decline.
So which came first, the chicken or the egg? Frankly, I don’t know. What I do
know is that historically, the indicator has done a nice job of being on the
right side of the market for major moves. You should be aware that over time
this indicator has given a decent number of false signals. For instance, after
last weeks column some people were wondering if the bearish move in the
indicator would be a useful short trigger. Historically, I would have to say,
“noâ€.
Since 1971, if someone shorted the market (either NYSE or NASDAQ) every time the
indicator flipped and the NYSE was leading, and then covered their short when
the indicator moved back to bullish, they would have lost money about 60% of the
time. From a profit standpoint this strategy would have been slightly profitable
for trading the NASDAQ and slightly unprofitable for trading the NYSE.
So what good is the indicator if it is prone to false signals and why would I
care that it recently went negative? Because over time it has consistently been
on the right side of major trends. Whether that is due to it being the chicken
or the egg I don’t know. I’d be very hesitant to try and trade against it for
any length of time. At the same time, due to the large number of whipsaws and
false signals, I believe it is better suited as a confirming indicator than as a
trigger. Currently it is flashing a warning sign…
Best of luck with your trading,
Rob
For those who may be looking to expand their
knowledge beyond just market timing, my
Hanna ETF Money Flow System utilizes the VIX in generating trading
signals for spread trades.
Rob Hanna is the principal of a money
management firm located in Massachusetts. He has spent the last several years
developing and refining methods for trading in stocks across multiple time
frames. He selects stocks using both fundamental and technical criteria, and
then trades them using technical analysis techniques.
