Get Ready To Play The Game Both Ways
Click here to listen to Kevin’s conference call from today.
What Wednesday’s Action Tells
You
The SPX
(
$SPX.X |
Quote |
Chart |
News |
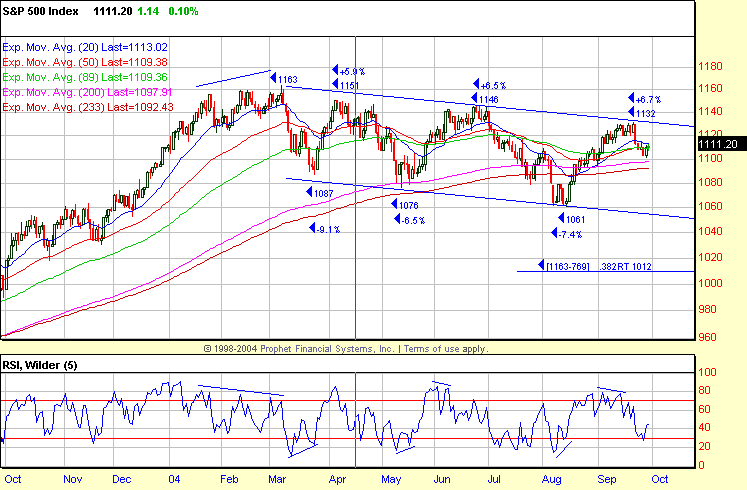
PowerRating) hit an 1131.54
intraday
high last week and could not get past the 1135 – 1141 anticipated resistance
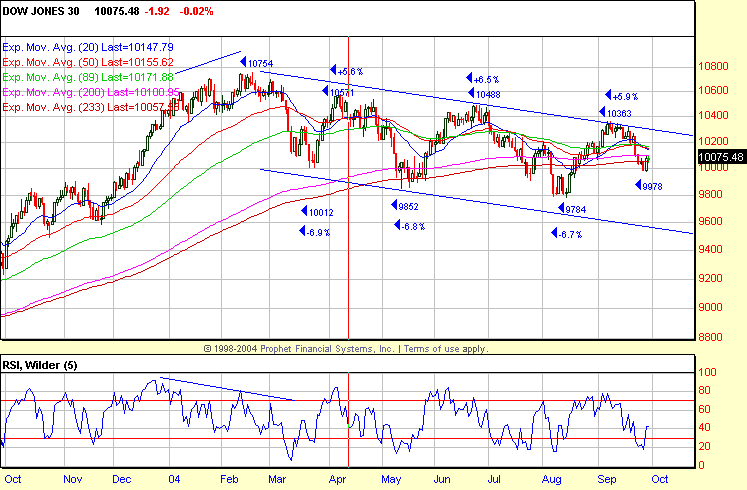
zone, in addition to the downtrend channel line. The Dow
(
$INDU |
Quote |
Chart |
News |
PowerRating)
peaked
right at its downward channel line at 10,363, hitting a 9978 intraday low on
Tuesday and below its 200-day EMA of 10,101 and 233-day EMA at 10,058. The
SPX
200- and 233-day EMAs are 1098 and 1092. The intraday low on Tuesday was
1101.
The five-week rally was +6.7% for the SPX, in line with previous bounces to
the
downtrend line. I have included both daily charts which highlight all of the
trading range channel moves, and it also reviews my perspective on where the
game is being played now so as to anticipate key price zones in conjunction
with
short-term overbought and oversold levels.
Yesterday’s market action had a month-end
touch
to it as the SPX traded in just a 5 point range between 1112.38 – 1107.36
until
a 2:30 p.m. – 4:00 p.m. ET mark-up into the 1114.80 close. The Generals seem
determined to keep the year-to-date price positive, which is above the
12/31/03
1111.92 close.
The SPX closed at 1114.80, +0.4%, with the
Dow
+0.6% to 10,136 and back above the 10,100 200-day EMA.
The semis were green all day with the
(
SMH |
Quote |
Chart |
News |
PowerRating)
+2.0% on less-than-average volume and carrying the
(
QQQ |
Quote |
Chart |
News |
PowerRating) to a +1.5%
35.08
close. All of the major sectors were green, except the
(
OIH |
Quote |
Chart |
News |
PowerRating)s, -1.6%,
which
has been on an upside tear into the $50 oil price.
NYSE volume was 1.4 billion with the volume
ratio
60, but breadth was just +326 which indicates that volume was concentrated
in
the big-cap, institutional window-dressing stocks into month-end.
Today’s
Action
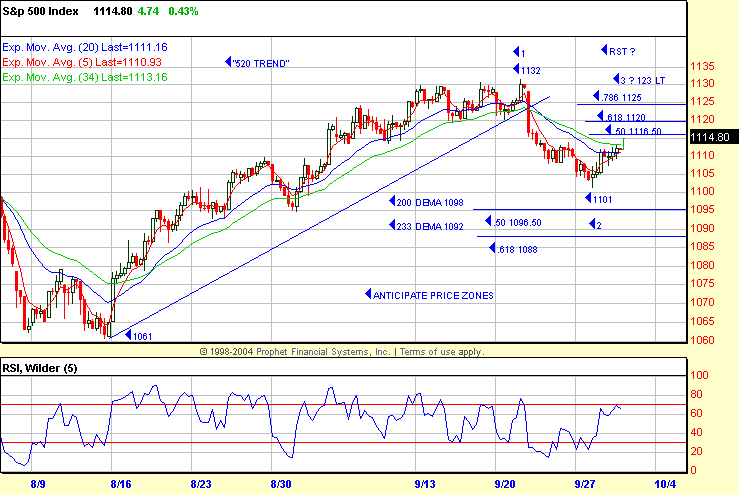
I have also included the “520
Trend” chart,
starting from the 1061 Aug. 13 low. I have overlaid the current framework in
both directions, which is in anticipation of higher-probability price zones.
This current reflex is coming from the 200-day EMA zone and yesterday’s 1101
low, in addition to a positive oscillator divergence from a short-term 5 RSI
oversold condition. The upside levels are indicated, and we can’t know
whether
it will be a 1,2,3 lower top from one of these zones or whether it will
trade
above 1132, where an RST and 1,2,3 higher top can possibly set up. The point
is
we are ready to play the game both ways starting with intraday
entry.
Those of you who have signed up for my
“Inner
Circle” program should save this chart, as I will expand on it as price
evolves,
in addition to further sequence.
The only thing I did before leaving last week
was
to put on an election long synthetic straddle as implied volatility is at
the
lows. I would say there is a high probability that this election will
provide
some volatility, in addition to the terror risk involved going forward. Went
out
three months on the options.
Today is the last day of the 3rd quarter so this
corner will only be involved in the highest probability setups, if they occur,
and will not be taking any probe trades in neutral price zones.
Have a good trading day,
Kevin Haggerty


Â
Â
