Head And Shoulders — A Pattern With A Target
A head-and-shoulders
pattern is probably one of the most well known reversal chart
patterns. As you know, it has a left shoulder, a head, a right shoulder, and a
neckline. A breakdown below the neckline signals a bearish reversal for a head-and-shoulders
top pattern, and a breakout above the line will be a bullish reversal for a head-and-shoulders
bottom formation.
Another unique feature of this formation is that you can calculate the projected
price target after breaking the neckline. This can be done by measuring the
distance from the neckline to the top of the head, then subtract this distance
from the neckline to obtain the downside price target.
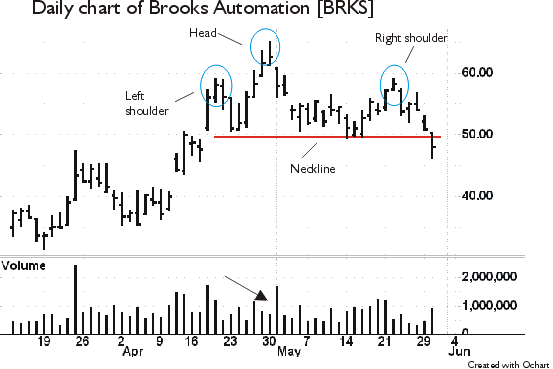
The chart below is a daily chart of Brooks Automation (BRKS).
As you can see, the issue broke down below its neckline on heavy volume today.
According to the calculation method above, the downside price target is 33.67.
Also, keep in mind that once the neckline is broken, it will become a potential
resistance level.

Finally, note how the head area was formed with decreasing volume. It was
another early warning signal.
Eddie
