Heads Up, Helmets On
The Nasdaq 100
(
NDX |
Quote |
Chart |
News |
PowerRating) gave you a second entry short below the 1768 numbers,
trading down to the 1.5 Volatility Band zone. This low was 1719.87 vs. the 1.5
band of 1718.80. The rally from there carried up to 1742, only to end with a
barrage of sell programs in the last hour, which sent the NDX down to a 1711.57
close — right on the longer-term .50 retracement level of 1711. (See my May
31 and June
11 commentaries for both the NDX and SPX reference points.)
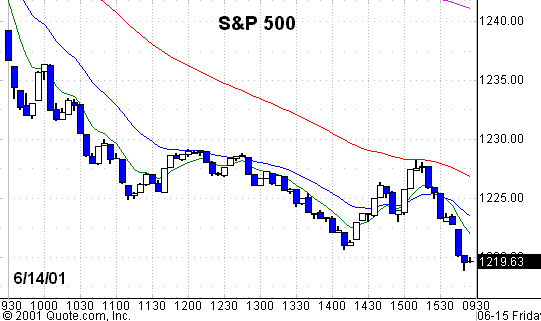
The S&P 500
(
SPX |
Quote |
Chart |
News |
PowerRating),
on the other hand, opened below the 1245.96 inflection point and never looked
back up. The decline halted at the 2.0 Volatility Band zone which was 1219.46
vs. the low of 1220.67. It was just an 8 point pop to 1228 before big programs
took it down into the close at 1219.87, right on the 2.0 Volatility Band.Â
The highest probability is
now a fact as the NDX has already retraced 50% of the 1349 low and the SPX is
following. The next stop for the SPX would be the .50 retracement level of 1200
where there is also the gap — and I refer to it as the 1200 magnet in previous
commentary. The SPX has given us a 22% run from the 1081 low, with the NDX
advancing 54% from 1349 to 2074 in just 34 days. Is that a familiar number to
any of you: 13, 21, 34, 55, etc.? Coincidence? Maybe, but does the coincidence
repeat often? Yes, it does.
In addition to the indexes,
there was a multitude of 100%+ stock gainers. What is your strategy now for your
long-term position money, as the indexes test the lows — or break them? Have
you looked at options strategies to take defined-risk positions at various
levels or else some scaled-into position entries at the lower levels? If you
don’t have a plan, then you will miss another great move like the one we have
just had. Bottoms are made at negative times, not obvious ones. Sooner or later,
you must make a decision.Â
We have the ever-increasing
dubious economic number from the Bureau of Labor Statistics today, plus Triple
Witch Friday which falls under “Who Knows?” You certainly have to be
ready for any pop back to the NDX 1768 and SPX 1246 levels. I expect further
decline after that and a possible waterfall into July and/or August which might
unnerve the troops but would provide excellent opportunities at great levels for
long-term money. As daytraders, it doesn’t matter as much, because you can play
the continuation in either direction as you identify the buying/selling
pressure.
Stocks
Today
|
(September
|
||
|
Fair Value
|
Buy
|
Sell
|
|
9.45
|
 10.55  |
 8.25 Â
|
There is certainly no
buying pressure, so there are hardly any long daily chart setups from yesterday.
A few that climbed the down ladder and acted fairly well are:
(
NVDA |
Quote |
Chart |
News |
PowerRating),
(
IDPH |
Quote |
Chart |
News |
PowerRating),
(
EBAY |
Quote |
Chart |
News |
PowerRating) and
(
AFL |
Quote |
Chart |
News |
PowerRating).
On the short side, take yesterday’s list and you can play any continuation with tight stops or just take
second-entry shorts if they want to play the game lower early on.Â
On a day like today, it
doesn’t hurt to just focus on QQQs, SPYs, DIAs or their index futures.
Have a good trading day
and a wonderful weekend.

Thursday’s SPX chart with 8-period,
20-period, 60-period
and 260-period
EMAs

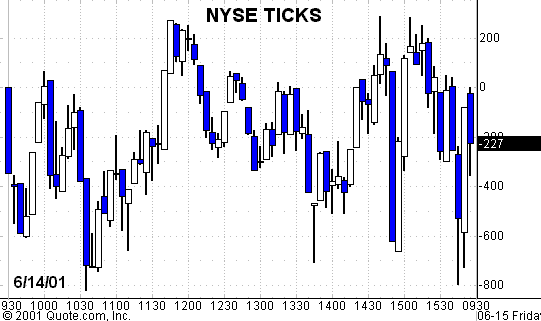
Thursday’s NYSE
TICK chart
Â
