High Probability Trading Report: Big Moves in IMAX and the Dollar’s Oversold Bounce
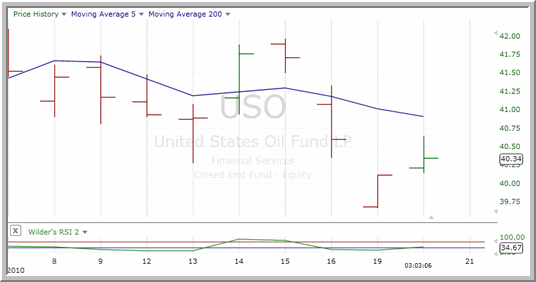
U.S. markets rallied back into overbought territory on Tuesday, following the Friday pullback. Energies were under the greatest buying pressure by sector, reflected as much in the rallies in stocks like ^HAL^ and ^RDC^, as by the performance of energy ETFs like the ^USO^.

USO, by the way, was among the funds earning the most signals from our High Probability ETF Trading Software going into trading on Tuesday. To learn more about trading with TradingMarkets High Probability ETF Trading Software, click here.
Let’s take a look at how recently oversold markets spotted by our high probability trading strategies and techniques have fared of late – starting with stocks.
Stocks:
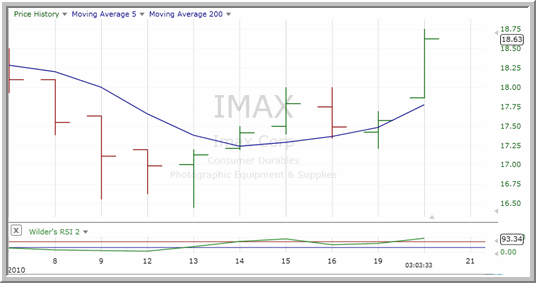
With the gain of more 6% in ^IMAX^ late in trading on Tuesday, high probability traders should recall that IMAX was among the most oversold stocks of the Nasdaq 100 a week ago.

IMAX had closed lower for four consecutive trading days, closing in oversold territory above the 200-day moving average on Monday. Three days later, the stock was up well over 4%.
How could traders have known that this kind of move was possible in IMAX? Research into short term stock price behavior since the mid-1990s shows that after stocks that are trading above their 200-day moving averages move lower by a large amount in a short period of time (the definition of an oversold market), they have a tendency to rally significantly over the short term.
This research, quantified and backtested by Larry Connors and his team at Connors Research, has been applied not only to short term high probability stock trading strategies (click here to order Larry’s book, Short Term Trading Strategies That Work), but also to short term high probability exchange-traded fund trading strategies.
Exchange-Traded Funds (ETFs):
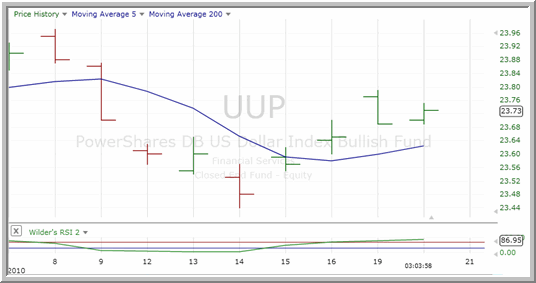
Consider the performance of one of the few oversold exchange-traded funds from last week – the ^UUP^ – after it pulled back into oversold territory above the 200-day moving average.

UUP closed in oversold territory on April 9th and then made follow-through closes on the 12th and 14th at lower levels.
This is exactly the kind of opportunity that short term high probability ETF traders look for – particularly traders who use High Probability ETF Trading Software (click here to learn more) to spot potential opportunities in oversold (and overbought) markets in a wide variety of exchange-traded funds. This includes leveraged and inverse leveraged ETFs, as well.
Within days after making its oversold lows, UUP was back on the move higher, closing higher for four consecutive trading days and giving high probability traders ample opportunity to sell their positions back into strength.
With Larry Connors’ High Probability ETF Trading Software, short term traders have access to the same kind of “buy the selling, sell the buying” trading strategies that professional traders have used successfully for decades.
Click here to start your free trial to Larry Connors’ High Probability ETF Trading Software today!
David Penn is Editor in Chief at TradingMarkets.com.
