High Probability Trading Report: Selling the Buying in Overbought Stocks and ETFs
With U.S. equity markets bounding higher and re-entering overbought territory below the 200-day moving average, high probability traders are turning their attentions back to the short side.
When it comes to markets trading above the 200-day moving average, the high probability approach to short term trading calls for “buying the selling.” This phrase, coined by Larry Connors, CEO
and founder of TradingMarkets, refers to a quantified strategy of buying markets after they have pulled back, and is at the core of all the trading strategies we develop.
When markets are trading below the 200-day moving average, the same quantified trading principle holds, only in reverse. Here, high probability traders are looking in essence to “sell the
buying.” This means that when markets are below the 200-day, the goal for high probability traders is to spot instances where markets have become overbought and to sell those markets short.
This is one of the first and most important rules for high probability traders trading stocks and non-leveraged exchange-traded funds: buy the selling above the 200-day, sell the buying below the 200-day. Sticking with this one rule can make a major difference in your short term trading, keeping you on the right side of the market and the historical edges on your side.
Stocks
Looking at the S&P 100, there are five stocks that high probability traders looking to take advantage of short term overbought conditions below the 200-day may want to keep an eye on. These
stocks range in sector from pharmaceuticals and drugs to gold to telecommunications. But all have moved deep into overbought territory below the 200-day and are increasingly vulnerable to
reversal based on our research into short term stock price behavior.
^ABT^
Two closes in extreme overbought territory below the 200-day moving average help put shares of Abbott Labs on the radar of high probability traders. The last time ABT has become as overbought as it currently is was back in mid-June shortly before the stock went on a seven-day streak of consecutive lower closes.
^FCX^
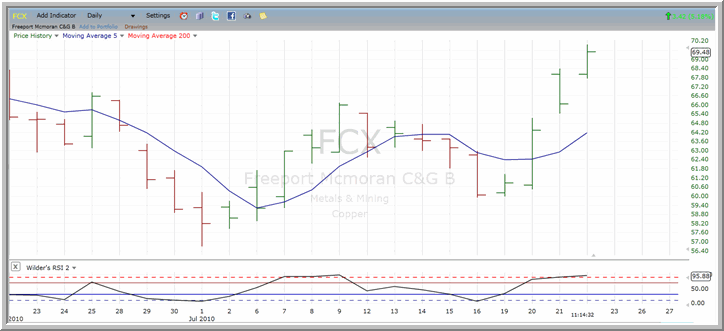
Soaring by more than 4% intraday on Thursday was Freeport McMoran Copper & Gold.

FCX has twice before climbed into overbought territory since slipping below its 200-day moving average at the end of April. And both instances led to significant, short-term sell-offs in the
second halves of June and July.
^GD^
Since dropping below its 200-day in the second half of May, General Dynamics has not often been in overbought territory. The last instance of truly overbought conditions in the stock came
fleetingly in mid-June. But despite the aggressive selling that followed, the stock had not been as overbought then as it is intraday on Thursday. Additional overbought closes below the 200-day
will likely make this stock an even more attractive candidate for high probability traders looking for markets at temporarily extreme levels.
^MS^
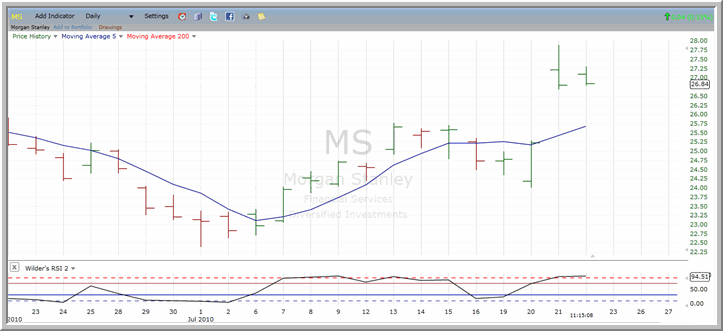
Shares of Morgan Stanley gapped higher on Wednesday and remain elevated midway through trading on Thursday.

The last ride through overbought territory in this stock was relatively recent, with shares of MS climbing into overbought territory in the first half of June. The sell-off following that
advance was relatively mild compared to some of the others noted in this report. But the oversold conditions that emanated from the selling proved to be fertile ground for the stock’s current
response – a spike back into overbought territory below the 200-day.
^T^
The last stock in today’s report is AT&T. Like Morgan Stanley, AT&T has been the beneficiary of strong buying in recent days, with buyers especially eager to pick up shares of the telecom in the first half of trading on Thursday.
Up well over 2% intraday, AT&T is among the more overbought stocks below the 200-day in the S&P 100. Additional overbought closes below the 200-day moving average will keep this stock on high
probability trading watchlists for potential opportunities to sell short.
Exchange-Traded Funds (ETFs)/Leveraged ETFs
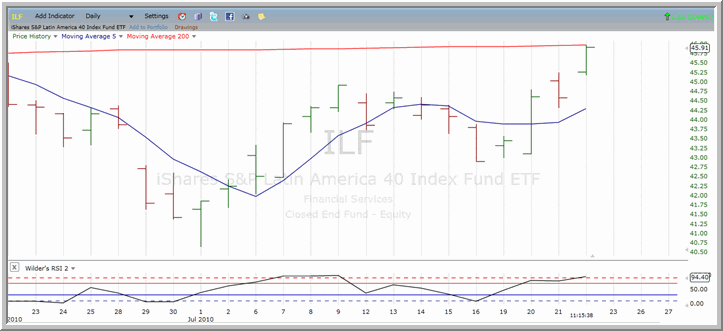
Going into trading on Thursday, many of the ETFs that were overbought below the 200-day have reversed and begun moving lower. These include a number of inverse leveraged ETFs such as the ^SKF^ and the ^DXD^. Two funds that remain overbought below the 200-day are the ^SLX^ and the ^ILF^ (below).

With Larry Connors’ High Probability ETF Trading Software, short term traders have access to the same kind of “buy the selling, sell the buying” trading strategies that professional traders have used successfully for decades.
Click here to start your free trial to Larry Connors’ High Probability ETF Trading Software today!
David Penn is Editor in Chief at TradingMarkets.com.
