High Probability Trading Report: Short Term Strategies for Selling Short
With a growing number of stocks and exchange-traded funds (ETFs) moving below their 200-day moving averages, more high probability traders are looking to the short side of the market for potential opportunities.
In the same way that tools like High Probability ETF Trading Software and strategies from the book Short Term Trading Strategies That Work can help traders make data-driven decisions when it comes to buying markets after they have pulled back, the same tools and strategies can help short term traders take advantage of markets that have rallied to levels from which, historically, they have tended to reverse and retreat.
Stocks
For high probability stock traders, the Relative Strength Index remains a valuable tool to detect when markets have become overbought and potentially ready to reverse to the downside.
The higher the 2-period RSI, the more overbought the stock. Stocks with 2-period RSIs of more than 90 are a good start for those looking to sell stocks short. Those edges improve dramatically when those 2-period RSIs rise above 95 and even more above 98. These extreme overbought conditions do not occur every day. But when they do, they can offer significant opportunities for short term, high probability traders.

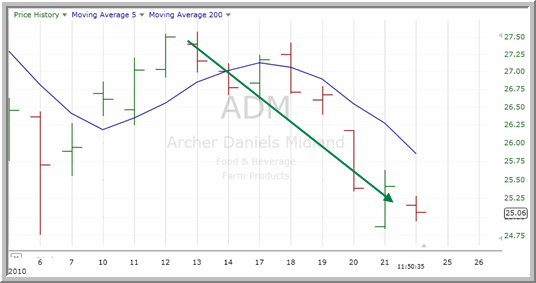
Above: Days after its 2-period RSI climbed above 90, shares of ^ADM^ continue to fall. The 200-day moving average is not shown, but is above price action in the chart.
What is critical when it comes to selling stocks short using high probability strategies is that the stock must be below its 200-day moving average (ideally at least 1.5% below). As the research in Short Term Trading Strategies That Works makes plain, short term highs in stocks below the 200-day tend to be short-lived. These bounces below the 200-day, based on our trading simulations going back to 1995, are the sort of short-selling opportunities that high probability stock traders should be on the look out for.
Exchange-traded Funds
High probability ETF traders looking to sell exchange-traded funds short have the automated signals of High Probability ETF Trading Software on their side. Again, the 2-period RSI is a major tool. But other indicators such as Bollinger bands and simple mean reversion patterns are incorporated in the 7 strategies in the Software.

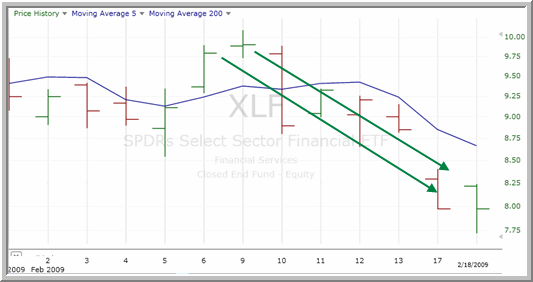
Above: Days after becoming overbought below the 200-day moving average, the ^XLF^ was down 19%.
As with stocks, the goal is to spot those ETF markets that are overbought below the 200-day moving average. These are the markets which have historically reversed in the short term, and should be the ones short-selling traders are adding to their watchlists when scanning for opportunities in overbought markets.
Another note: the same scale-in tactics that make high probability trading strategies so robust on the long side also apply to high probability trading strategies on the short side. That is to say that traders who add an additional unit short when a market closes even further into overbought territory can significantly improve their accuracy rate. Consider below, three comparisons of regular and aggressive versions of the same high probability ETF trading strategies:
Performance since inception through December 2008 in 20 of the most widely-traded ETFs including the ^SPY^, the ^FXI^ and the ^XLF^.
RSI 25/RSI 75
Regular version: 68.1%
Aggressive version: 75.2%
Multiple Days Down (MDD)/Multiple Days Up (MDU) Strategy
Regular version: 71.1%
Aggressive version: 77.1%
R3 Strategy
Regular version: 70.4%
Aggressive version: 75.6%
To learn more about high probability trading strategies with exchange-traded funds – both long and short – click here.
David Penn is Editor in Chief at TradingMarkets.com.
