High Probability Trading Report: Strategies and Opportunities in the Oil Patch (XLE, ERX, BP, HAL, DIG)
The oil disaster in the Gulf of Mexico has understandably focused attention on not just the future of ^BP^, but of other oil and energy companies like ^HAL^ and ^RIG^, as well. And interest in energy stocks means more interest and potential volatility for energy-related exchange-traded funds (ETFs), from the ^XLE^ to the ^ERX^.
It is always tempting for traders to trade the markets that are in the news. But this additional news focus can be as much a source of unwelcome distraction as it can be a source of very welcome volatility (remember, for high probability short term traders, volatility is your friend). However, by sticking with quantified, backtested trading strategies – such as those found in High Probability ETF Trading Software – high probability traders can navigate these newsy, headline-driven markets with a disciplined, professional approach.
With that in mind, let’s take a look at some of the recent market action in these sectors through the prism of high probability trading principles.
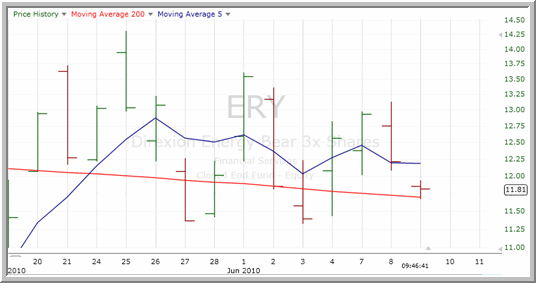
Both the ^DUG^ and the ^ERY^ (below) are on “pullback watch”. Both funds rallied up above their 200-day moving averages in May and have since moved into relatively tight consolidation ranges just above the 200-day. As these inverse leveraged energy ETFs become oversold above the 200-day moving average, high probability traders may again consider trading them – this time to the long side.

At the same time, both funds are very near their 200-day moving averages. Should traders begin scaling into these ETFs, keep all purchases (entries and adds) above the 200-day.
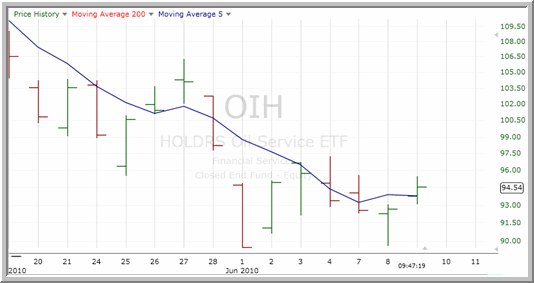
On “bounce watch” are a number of energy funds – both leveraged and non-leveraged – that have moved below their 200-day moving average and may be considered for potential short trades during bounces.

Among these ETFs are the ^DIG^ and the ^OIH^ (above). Additional strength in these funds (as well as the XLE and ERX mentioned above) likely will allow high probability traders to begin scaling in on the short side.
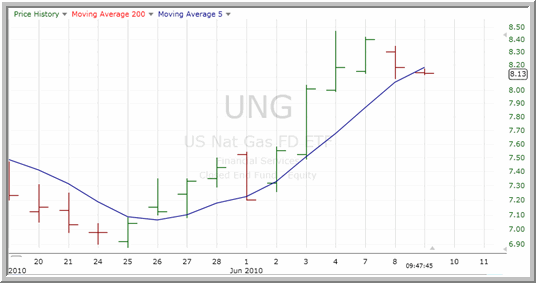
One exchange-traded fund that should be discussed in the current trader favorite: the ^UNG^ (below).

As I have written before, UNG has been a trader favorite for the past several weeks, reliably reversing back to the downside after becoming overbought below the 200-day moving average. Traders following UNG have seen this happen repeatedly this year: in early April, late April, mid-May and late May.
Of late, UNG has been among the most overbought ETFs trading below the 200-day moving average, closing in overbought territory for four consecutive trading days before beginning a potential reversal on Tuesday. A close below the 5-day moving average today – or a close in oversold territory – will allow traders who have been short this overbought ETF an excellent opportunity to lock in gains.
With Larry Connors’ High Probability ETF Trading Software, short term traders have access to the same kind of “buy the selling, sell the buying” trading strategies that professional traders have used successfully for decades.
Click here to start your free trial to Larry Connors’ High Probability ETF Trading Software today!
David Penn is Editor in Chief at TradingMarkets.com.
