High Probability Trading Report: Strategies for Overbought Stocks and Oversold UltraShorts in Oil, China, Financials
Over the past four days leading into Monday’s trading, the ^SPY^ went from having a 2-period RSI of more than 90 to a 2-period RSI of less than 25.
The ^QQQQ^, trading above the 200-day, had closed lower for three days in a row. The same was true for the ^IWM^.
This is how high probability trading opportunities are made. As markets moved lower over the past few trading sessions, high probability traders were scaling-in. And with Monday’s big oversold bounce came great opportunities for high probability traders in exchange-traded funds like the QQQQ and the IWM to lock in short-term profits.
Let’s take a look at some of the current potential opportunities that are developing – in stocks as well as exchange-traded funds.
Stocks
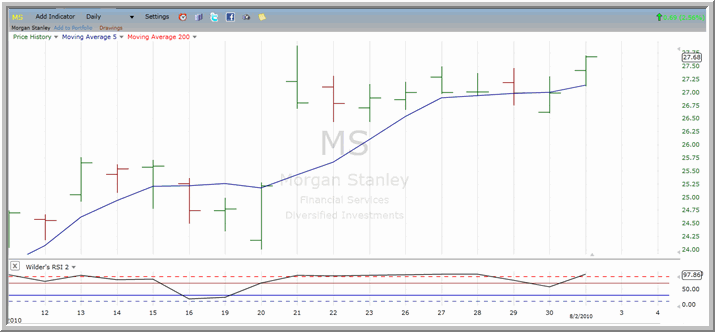
Monday’s big bounce from oversold conditions resulted in widespread overbought conditions in a variety of stocks – including many stocks of the S&P 100. These stocks, which are becoming increasingly overbought below their 200-day moving averages, include financial stocks like ^MS^ (below) and ^BAC^ as well as commodity-related stocks such as ^MON^ and ^FCX^.

Traders looking into potential opportunities in selling short overbought stocks should note which stocks are nearing their 200-day moving averages. High probability trading strategy calls for only selling short overbought stocks that are trading below their 200-day moving averages. For more tips on trading stocks based on these quantified, high probability trading principles, click here to learn how to get your copy of Short Term Trading Strategies That Work – 16 backtested trading strategies for bull, bear and sideways markets by Larry Connors and Cesar Alvarez.
Exchange-Traded Funds/Leveraged ETFs
Here’s your high probability ETF/leveraged ETF trading pop quiz.
If the Dow rallies by 208 points, then which exchange-traded funds (ETFs) are most likely to be OVERSOLD?
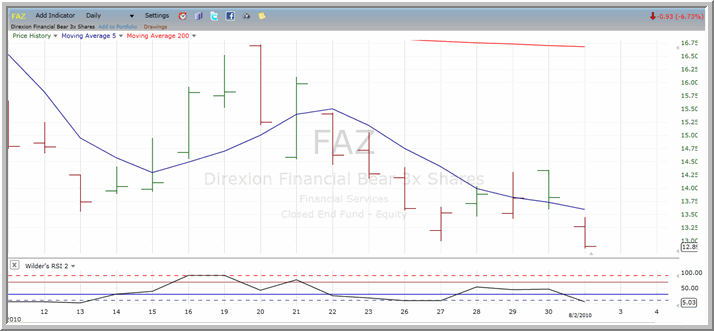
More often than not, the answer is inverse leveraged funds. These are funds like the ^SDS^ and the ^FAZ^ (below) which track the opposite or inverse of their respective indices. In the case of the SDS, that index is the S&P 500. In the case of the FAZ, that index is the Russell 1000 Financial Services Index.

When markets make major moves to the upside, these inverse ETFs tend to make corresponding moves downward. And the combination of a big move to the upside (or, better, multiple days of such moves) and a leveraged response to the downside often makes for significant opportunity in inverse leveraged ETFs from a high probability trading perspective.
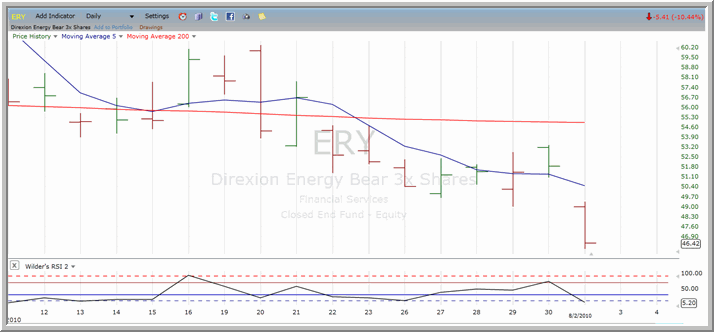
Some of these oversold, inverse leveraged ETFs that high probability traders might want to add to their watchlists include the ^EEV^ and the ^ERY^ (below).

Outside of the leveraged and inverse leveraged ETF world, we restrict our targets for oversold funds to those trading above the 200-day moving average when it comes to potential long trading candidates. In other words, the 200-day moving average is a factor for non-leveraged ETFs, while it is not a factor for leveraged (and inverse leveraged) funds.
Among the former group, bond ETFs like the ^AGG^ and the ^HYG^ are among the few non-leveraged ETFs that have become oversold above the 200-day moving average.
With Larry Connors’ High Probability ETF Trading Software, short term traders have access to the same kind of “buy the selling, sell the buying” trading strategies that professional traders have used successfully for decades.
Click here to start your free trial to Larry Connors’ High Probability ETF Trading Software today!
David Penn is Editor in Chief at TradingMarkets.com.
