How I Trade Dead Cat Bounces, Part 2
In part 1 of our technical price pattern analysis, John Jagerson discussed how relatively easy it is to identify The “Dead Cat Bounce”. To read part 1 of “How I Trade Dead Cat Bounces”, click here.
Identifying a dead cat bounce is just part of the challenge. Estimating or forecasting the likely distance the stock will move following the pattern is also important. There is a reasonably easy way to start making these estimates following the bounce back down from resistance.
To do this we will be using fibonacci retracements, which are one of the primary tools used by technicians to identify support and resistance levels and to make price projections.
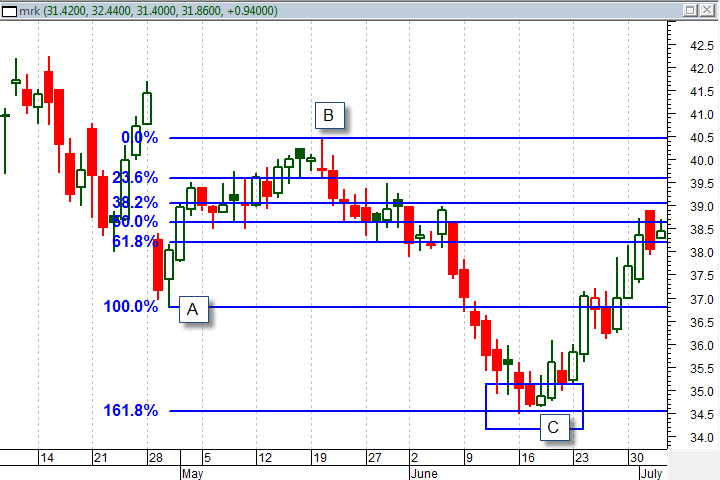
The image below illustrates how this analysis is conducted. A fibonacci retracement is drawn from the first bottom following the gap (point A) to the break from resistance at the top of bottom of the gap (point B). The retracement lines themselves can be ignored because what you are interested is past the first low at the 161.8% projection level (point C).
As you can see in the case study below this price was easily reached. Of course, ongoing trade management continues to be important but this analysis provides a solid starting point for evaluating the opportunity.

John Jagerson is the author of many investing books and is a co-founder of LearningMarkets.com and ProfitingWithForex.com. His articles are regularly featured on online investing publications across the web.
