How intraday charts can help time your entries
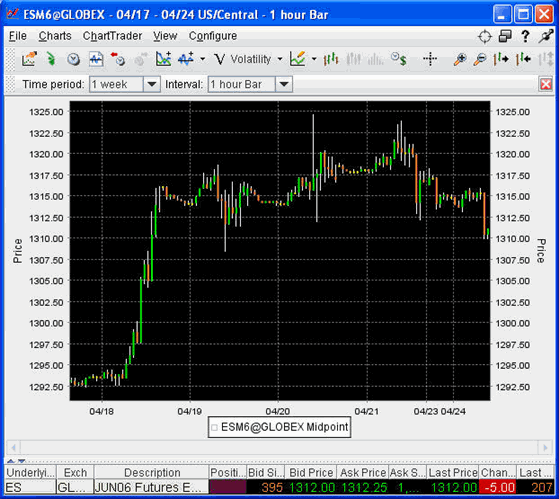
The stock market has started today a little soft with a morning
sell-off taking out some short-term support points, as can be seen in the hourly
chart below (hourly for the June contract). In the grand scheme of things,
though, what we are looking at is probably a good buying opportunity.
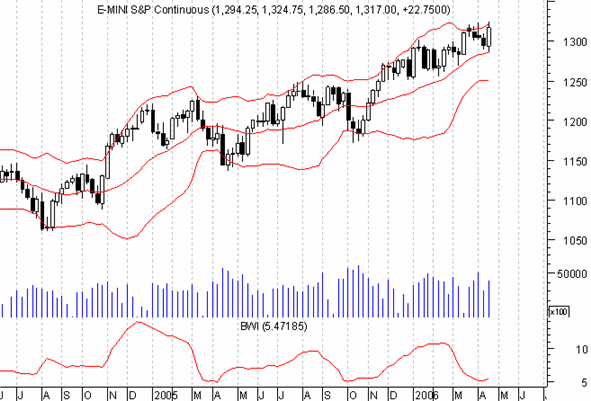
Consider the weekly chart (continuous contract) of the S&P futures
shown below. It’s pretty clear that the market is in a sustained up trend.
Last week’s close was the highest weekly finish since early 2001. That, in
and of itself is a pretty good reason to hold a bullish bias when trading this
market.
There is more to the situation, though. The Bollinger Bands can be a
very good indicator of when a market is “trend ready”. Narrow bands are
often precursors to significant directional moves. We can use the Band
Width Indicator (BWI) to help us pick out then the Bands have gotten relatively
narrow (lower plot on the chart above).


Notice how low BWI got going in to the month of April. That was thanks
to the relatively low volatility seen so far this year (at least from the
perspective of this timeframe). The low BWI suggests a market ready to
make a significant move. Importantly, BWI ticked higher last week as the
market made its new closing high. A low BWI reading in and of itself is
not enough. We must see the reading starting to rise from a low point
before we can get excited. That appears to be happening now.
Ideally, we would like to see BWI rise again this week as real confirmation, but
at least we can start looking for something to happen.
So how do we play this? One alternative is to look for short-term
support points to use as low risk buying levels. The more conservative
approach is to wait until the bulls re-emerge. If the market reverses
course and rallies back above 1317.50 (June contract), it should be a good
indication that the upside is going to dominate in the near term with real
potential to carry over in to the longer-term. If there is confirmation of
the combined BWI and price rises this week, the we have to be looking for an
eventual move toward 1385.
John Forman is the author of
The Essentials of Trading
(Wiley). To celebrate the book’s release later this week, there will be a
special 24-hour only promotion with giveaways worth $1000s. Find out more
at
www.TheEssentialsOfTrading.com/special-offer.html.
