How to Apply Leading Indicators to Both Forex and Equities Trading
A leading indicator, also called an oscillator, is a motion or force that moves back and forth between two points. It is a technical analysis tool that is used as a trend indicator for identifying trends when they are not clearly identifiable. It is most commonly used when the currency or underlying stock has traded in a specific direction for some time and it appears that it may reverse, although it may not be obvious upon first glance.
Click here to learn how to utilize Bollinger Bands with a quantified, structured approach to increase your trading edges and secure greater gains with Trading with Bollinger Bands® – A Quantified Guide.
These leading indicators are used to find a breakout into an upward or downward trend and are often meant to identify reversals. They will potentially signal a buy or a sell when the market is oversold or overbought and the previous trend has run its course.
Stochastic, Parabolic SAR, and the Relative Strength Index (RSI) are all oscillators. Each indicator/oscillator can signal a possible reversal, where a previous trend has ended and the price is ready to move in a different direction.
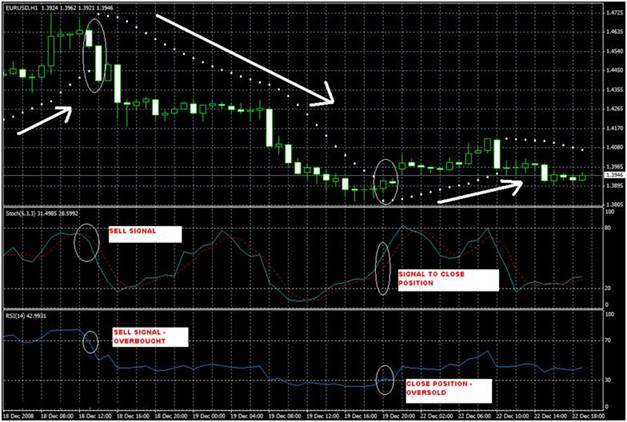
Below is an example of how all three indicators lined up to give us the proper signals: On the 1-hour chart of EUR/USD below, we added Parabolic SAR, Stochastic and RSI indicators.

There are sell signals between the hours of 8:00 am EST and 9:00 am EST on 12/18/08. All three sell signals occurred within one hour of each other. This would have been an excellent trade. As you can see, the Parabolic SAR indicator gave us a good sell signal and the RSI indicator remained in the overbought position for a long time and then ventured out. Usually when an indicator remains in the overbought or oversold level for a long time, it means that a strong trend will occur upon breakout. The Stochastic was not really in the overbought position, but still showed us the crossing of the two time intervals in a downward trend.
A sell could have taken place between 8:00 am EST and 9:00 am EST. Let’s say we sold at 9:00 am EST, just to make sure there was a trend occurring and so we didn’t receive any false signals. We would have sold at a price of 1.457 on the open of the new candle.
The position would be held until the next signal, which did not occur until 9 pm EST. The RSI Indicator showed us a breakout from a long oversold period and the Stochastic had already broken out and actually crossed way before, but was now in a definite upward motion. The Parabolic SAR had also indicated an upward trend at this time and the candle was pushing towards a buy. All of these indicators aligned at 9 pm EST and indicated that we need to close out the position. The trade would have occurred at a price of 1.391 at the close of the candle.
The total trade amounted to 660 pips in one day! Of course, there would have been a carry charge, but that’s still a great trade.
Since our chart was on the 1-hour time frame, the Stochastic indicator was based on the high-to-low of that particular time frame, but does not account for changes from the previous hour to the next one. The RSI indicator establishes one candle’s closing price in relation to the next. A Parabolic SAR indicator is only useful in a trending market and gives you particular entry and exit points by way of space or positioning of the dots.
These indicators are not always accurate, but can aid you in your trading endeavors, especially if all three line up accurately. Of course, we know that a particular chart pattern does not always indicate a reversal and sometimes leading indicators can lead to error. Whatever indicators you decide to use, it is important to make sure they are in line with your trading style and with your buy/sell entry and exit points. If your indicators do not line up, you are better off waiting it out for the next trade. The last thing you want is to be in a trade because you are anxious and want to get in the market. It is better to make sure you have done your homework, when everything lines up and it makes the most sense to get in.
John A. Taxiarchos is a seasoned professional investor/trader with over 10 years of experience in the equities, futures and FOREX markets. John started his career as a registered representative for a Top Ten Investment Bank. As trading technology advanced, John shifted focus on trading strategies in the Forex market. He is currently a Market Analyst for Traders Choice FX: www.traderschoicefx.com
Backtested on over 17,000 trades test this new trading indicator for Leveraged ETFs and find high probability setups daily – click here now.
