How to Take Advantage of Gap Moves in the E-minis
Windows Left Open
Any gap-open event on an intraday basis is probable to fill inside that same session roughly 75% of the time. In other words, three out of every four gap-open events will fill that gap by or before the opening bell. One out of four gap-open events (on average) will remain open all day… aka gap & go trend session.
How do we handle those? Are there patterns or clues the market leaves behind that could tip us off as to which type of gap session is what?
We can never be absolutely sure that a gap-open session will remain that way or fill the hole by 4:15 pm est. Those of us who’ve been around awhile have seen numerous days where it seemed impossible for price to reverse and close the distance, only to do so in spectacular fashion (up or down) before the end bell rings. There is no way to ever be certain of any session winding up with a gap closed or left open. For that matter, there is no way to be certain about anything to do with financial markets at all. But some predictable patterns and behaviors tend to repeat themselves, well, repeatedly.
Gap & go sessions are usually low energy affairs. In other words, they open with emotion but quickly quiet down. Instead of pounding volatility and wide, sideways swings all day, the initial surge tends to calm right down in rather dull fashion. It’s as if the market expended all energy in the premarket surge, then needs to pause for a few hours to gather some steam. Gap-open sessions that immediately surge further to extreme levels away from prior day’s close are much more likely to reverse and close, than a session which gaps open and listlessly plods in the same direction with low energy.
Stated another way, price action that keeps surging in direction of the gap early on is exhausting directional energy early. All of those gap-trend followers cover lots of ground early, then have hours on end to ponder if they should sit on those unrealized gains or start peeling off profits. It is the very act of profit taking which creates a reversal squeeze to fill the gap. Everyone who wanted to buy or sell the surge has done so… early. Now the move is exhausted, no one left to keep pushing direction and therefore fundamentally the gap move is done.
Gap-open sessions on the other hand do not exhaust all energy early. The first wave hits prior to opening bells. After that, a deliberate bleed higher or lower keeps the grinding plod going all day. There are two very strong clues as to which type of day it will be that we can remain alert for and to exploit for profits.
Figure 1: 01/29/2009 ES 10-Minute Chart
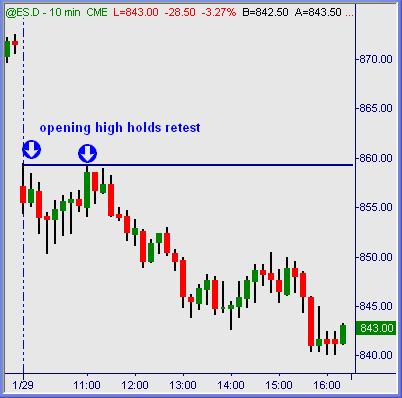
The first pattern for probability of gap & go days is an early test of the opening extreme. In this case, an early reaction high towards direction of the gap fill swung lower with further selling. A late-morning test of that high was met with further selling… highs were rejected sharply. That in itself is a very strong clue that more continuation lies ahead.
Figure 2: 01/28/2009 ES 10-Minute Chart
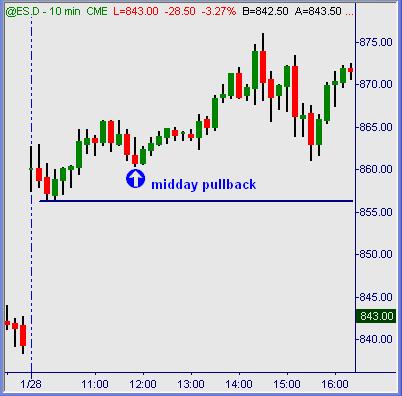
Many if not most times the morning high/low will not be tested. What will happen instead is some degree of pullback towards the gap that makes a sharp surge move back in direction of the trend. This example of January 28th gap & go demonstrates a midday pullback in TF which was immediately hit with continued buying in the straightest swing move all session.
That is a very common pattern of behavior: a midday pullback to test the directional trend is met with a surge of buying / selling that continues the gap & go move. This particular swing is usually the straightest and easiest trade to take all day. It often marks the last reaction hi/lo which if held until the close would result in big profit gains.
Figure 3: 01/20/2009 ES 10-Minute Chart
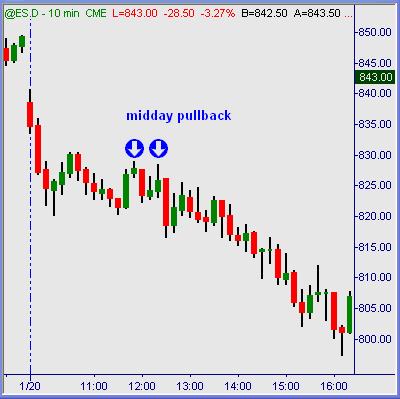
January 20th, same story. Midday pullback against the prevailing trend was hit by two waves of program selling. Shorting in the 825+ range and held into the late afternoon or close resulted in the typical big-profit potential that gap-trend days commonly offer.
Figure 4: 01/07/2009 ES 10-Minute Chart
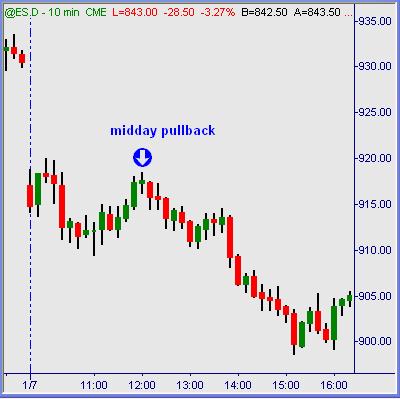
January 7th? We see the same general pattern repeated over and over again. Pullback against the trend, nearly hits morning reaction highs, sharp selling to continue that trend. Short from the ES 915 area held with confidence offers big potential profits to you intraday.
Summation
No one on earth can predict what’s going to happen all day or all parts of a day. That simply does not happen. What we can learn to anticipate are certain probabilities created from specific pattern behaviors in a market. Those patterns repeat until the end of time solely because the strongest constant known to man is the driving force behind them: collective human emotion, aka herd behavior.
Learn to watch for it, anticipate it, react to it and profit from it.
Austin Passamonte is a full-time professional trader who specializes in E-mini stock index futures and commodity markets. Mr. Passamonte’s trading approach uses proprietary chart patterns found on an intraday basis. Austin trades privately in the Finger Lakes region of New York. Click here to visit CoiledMarkets
Click here to sign up for a free, online presentation by Larry Connors, CEO and founder of TradingMarkets, as he introduces The Machine, the first and only financial software that allows traders and investors to design and build quantified portfolios.