How to Trade the Market Using Keltner Bands
In these current times of increased economic and political uncertainty the market has experienced some wild volatility. The question is HOW do we make money from this?
Click here to order your copy of The VXX Trend Following Strategy today and be one of the very first traders to utilize these unique strategies. This guidebook will make you a better, more powerful trader.
Everyone will tell you that the market can not be predicted and they would be right, especially in this kind of environment but what they don’t tell you is even though you can not predict the market you can measure it, contain it and profit from it and that’s where volatility becomes your best friend.
So how do we measure and contain the market so that we have a clear understanding of the current conditions?
One of the tools that I use is Keltner Bands but you can also use Bollinger Bands if you prefer.
Most people will tell you that these indicators should be used as a means of entry/exit i.e.: when a stock price gets to the band and your moving averages cross sell/buy but I disagree with that fundamentally. It’s the equivalent of planning a picnic before you check the weather (not a good idea).
I like to use these bands as a measurement for the current volatility level and then decide on my trade strategy.
Let me give you a few examples of what I’m talking about.
Example 1
Strong Directional Moves.
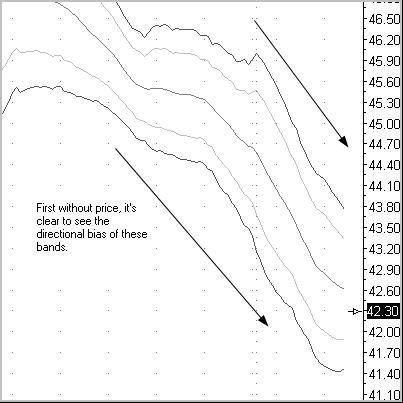
Next…
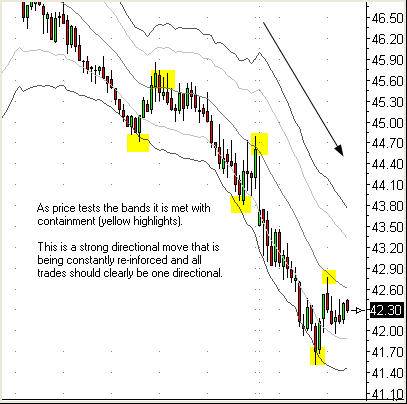
Another Example:
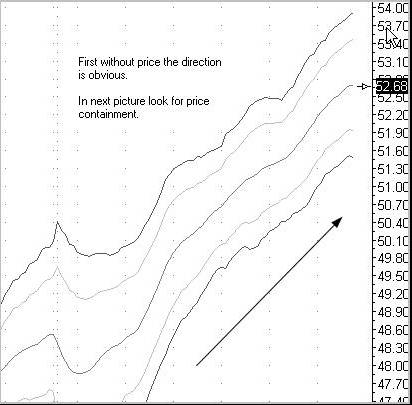
Now that we have seen what a directional market looks like and behaves like, let’s look at a choppy none directional market where we can sell the highs and buy the lows with some degree of certainty.
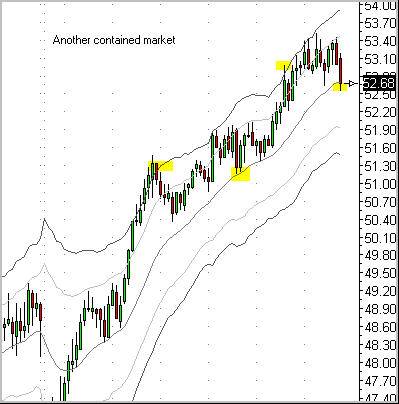
Example of a non directional market through the eyes of band containment.Â
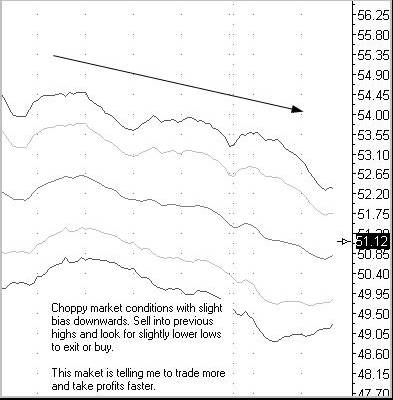
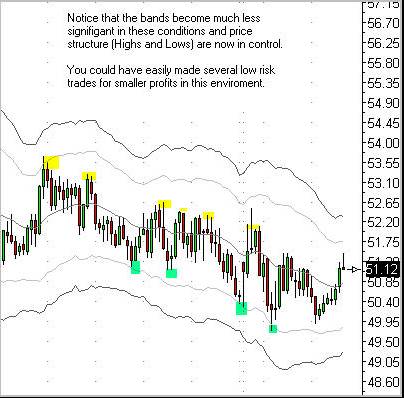
Once you begin to view bands as “measurement tools of containment” and HOW is price behaving within or outside of them you should see the market with new eyes and I believe that this is a far superior method to measure current volatility levels (and then) plan your trades accordingly.
Sam Patterson has over 20 years of experience in day trading and has worked as both a broker and an analyst. As an apprentice stock broker, Patterson experienced first-hand the stock market crash of 1987. Seeing how easy it was for fortunes to get wiped out overnight, he left the brokerage firm and began day trading for himself. Patterson’s extensive experience on the “front-lines”, gives him the rare ability to teach and share his technical analysis with others. Patterson resides in Canada and is currently an individual day trader. If you are interested in being mentored by Sam, contact him directly at sptrader@rogers.com.