How to Use Charts to Make Trading and Investing Decisions, Part 2
How charts can help you make better investment decisions
Part 2 of 2
In part 1 of this series, we looked at what charts can do to help us make the decision only we can make – whether to buy, sell or hold. In this installment, we’ll take a look at how we actually use charts. This is far from a comprehensive lesson on chart reading but it will serve to present the basic concepts.
Reading a chart
The biggest myth concerning chart reading is that its practitioners are attempting to predict the future. What they are attempting to do, above all else, is decide if they should buy the stock or sell the stock.
That is the only part of investing that we can control and nobody can predict the future. We take actions to prepare for what we think the future will bring, but understand that knowing the price of a stock a month or a year from now, is impossible.
What chartists do first is simply take a look at the chart to see what is obvious. Is the general trend of prices rising? That’s good. Is the stock trading sideways in a choppy manner? If so, does the pattern formed have any shape such as a triangle or trading range?
All of these questions help us determine if there is a bull or bear market in place or if the stock is just marking time. Chartists simply buy stocks in rising trends – sometimes following the strategy to “buy the dips” – and sell them in falling trends – sometimes “selling the rallies.” And when there is no trend, they wait for prices to move higher or lower from patterns – breakouts – and follow along with what the market is telling them.
Oversimplified, for sure, but these actions form the basics for using charts.
Here is an example of how we can tell when the market has decided it has licked its wounds long enough after a bearish trend, and is ready to move higher. DuPont had a rough go of it from April to July 2006, falling some 13%. After two months of sideways action, in what chartists call “forming a base,” something happened in September to tip the scales of supply and demand in the favor of the bulls. The stock moved above its base and up it went.
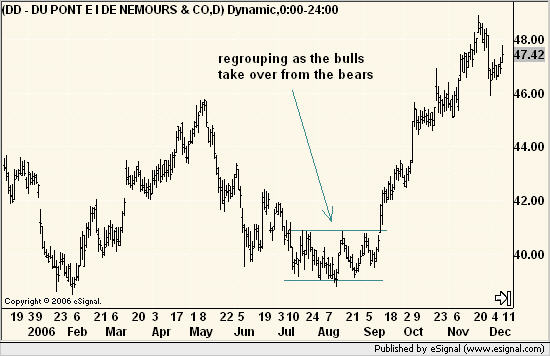
Chartists are not concerned with why the stock started to move and are happy to let analysts and journalists try to explain it. All they want to know is that the market made a decisive move, so they can hop on the train as it leaves the station. They are satisfied knowing that demand suddenly overwhelmed supply and feel no need to buy the absolute low point or predict where the stock may eventually go. The decision is “buy.”
The best way novice chart readers can begin to use them is to first do their own research, whether it is fundamental or any other, and then see if the chart agrees.
For example, you might believe stock XYZ has good earnings prospects, is a leader in its industry and a major brokerage firm analyst has just upgraded it to a “buy.” However, the chart shows that prices had been rising nicely for nearly a year before making a sharp break lower.
Could it be that the market thinks that all the good news is already priced into the stock and profit-takers have begun to get active? Perhaps this great company does not have such a great stock.
In another example, a stock that has traded sideways for a year, essentially forgotten before its next earnings report, and that report is expected to be rather weak. You are tempted to sell this non-performer, possibly at a loss, so you can put your money to work elsewhere.
When the news is released, the actual numbers looks rather flat but the stock rallies that day above the top of its range. What happened? The news was certainly not that good.
We can explain it by saying the news was not as bad as expected, but the bottom line is that, after the report, demand for shares suddenly increased. The market was voting that better times were ahead and that means you should not sell but rather hold on for a while longer.
It is difficult to go into more detail in terms of specific buy and sell situations in such a short article, especially when there are no chart examples accompanying it. If there is one message to take away now, it would be that charts tell us if a stock is going up, down or sideways, as well as, let us know sooner rather than later that these conditions have changed.
No matter what the analysis of the company says, its stock price will not move unless there is a change in supply and demand in the market. Charts tell us when that happens.
Chartists are not trying to predict the future, although they need to have some sort of forward looking mindset. The key is to see if the market is moving higher or lower or if it is resting before making up its mind. Nothing mysterious about that.
A chart is a tool, not a crystal ball. It cannot see into the future but it can help us decide what to do right now no matter what type of investor – short-term or long-term – you are.
Michael Kahn writes the twice-weekly “Getting Technical” column for Barron’s Online and edits the daily Quick Takes Pro newsletter. He is also the author of three books on charting, the most recent being “A Beginners’ Guide to Charting Financial Markets.” Read his blog at www.quicktakespro.com/blog.