How to Use the Put/Call Ratio & 3 PowerRatings Stocks
The stock market has been sliced and diced in literally 100s of different ways. Indicators, ratios, and averages have become the manner the stock market is observed, interpreted and decisions made.
One of the most popular ratios for calling future market direction is known as the Put/Call Ratio. It is simply the number of Put options divided by the number of Call options for all equity and index options traded on the Chicago Board of Option Exchange.
A high reading of the ratio reveals fear in the market as more puts are being bought. Low readings indicate confidence as more investors are going long the market via calls. Most traders consider this ratio a contrarian indicator. This means that a high reading of fear indicates the market is about to reverse with a move higher. Whereas a low reading indicates that stocks are about to reverse by dropping.
Compare this idea to the overbought and oversold concept: a low reading means stocks are overbought and a high reading means shares are oversold. As in most things market related, these concepts are somewhat nebulous and lacking in statistical usability, exact parameters.
We decided put the Put/Call Ratio idea to the test. However, just how do you define a low or high reading so that this idea can be tested? It was decided that high readings for the purposes of the testing would be those that fell in the top 5 or 10%. Low readings would be those that fell into the bottom 5 or 10% of all readings. The median reading was 0.68, therefore the top 5% were 0.97 and higher.
The top 10% were 0.90 and higher. The bottom 5% were 0.47 and lower and the bottom 10% were 0.50 and lower. The results concurred with the original premise that high Put/Call ratios outperformed low Put/Call ratios.
In this case, our statistically valid testing revealed that the general consensus regarding the Put/Call ratio is correct.
Right now the Put/Call ration is 0.79. This is approaching the higher end, but still has a ways to go to be considered a high reading. Some followers of this ratio would interpret the reading to indicate there is still further upside left in the stock market. However, the top is getting close!
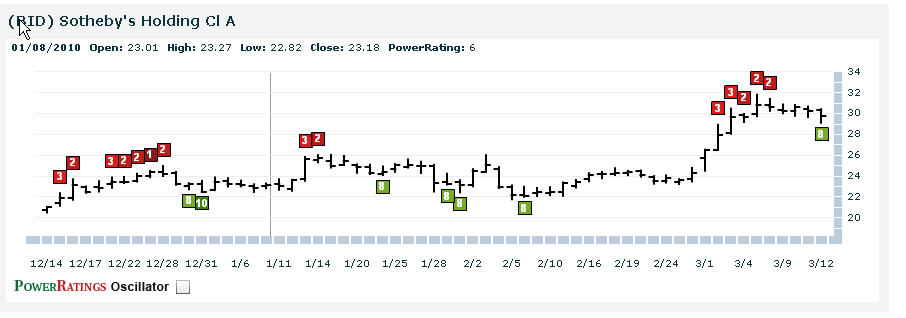
Here are 3 top rated PowerRatings stocks:
^BID^

^MHR^
^MLNK^
Learn more strategies for trading stocks in the short term with a free trial to our PowerRatings! The highest rated stocks have outperformed the average stock by a margin of more than 14.7 to 1 after five days! Click here to launch your free PowerRatings trial today!
David Goodboy is Vice President of Business Development for a New York City based multi-strategy fund.
