How to Use the Stochastic Oscillator to Trade in Volatile Markets
Unless you’ve been on Mars, you know that in 2008 the stock market became a lot more volatile than it has been in recent history. In fact, 2008 was the 3rd most volatile year in stock market history, with the other two coming in the 1930s during the Great Depression.
And this volatility has created all kinds of problems for investors, big problems like trillions in wealth being erased for asset allocators and “buy and hold” investors and even problems for active traders who are supposed to be able to trade these kinds of markets.
Of course the problem for active traders is that the volatility has rendered many of their trusty tools null and void. The magnitude and speed of the directional changes in volatile markets invalidates many indicators like moving average crossovers, RSI and the like, which are just too slow to respond to fast moving markets.
And the result is that active traders have been whipsawed by the market’s gyrations and too many times found themselves on the wrong side of the move, looking in “the rear view mirror” instead of trying to look out at the road ahead.
Click here to learn how to utilize Bollinger Bands with a quantified, structured approach to increase your trading edges and secure greater gains with Trading with Bollinger Bands® – A Quantified Guide.
So what’s a trader to do?
I spent several weeks asking myself that very question as I found many of my indicators coming up short. And my questioning led to a review of all 14 indicators I use. Of those, which have been tried and true through all kinds of market conditions, one stood out as being truly outstanding and reliable. And that indicator is, drum roll please… Full Stochastic.
Now you might be disappointed that such a well known indicator has proven to be so effective in recent volatile markets, but don’t be. I don’t know about you, but I’ll take all the help I can get to remain profitable when only a small percentage of money managers, newsletter writers and active traders have been able to do that during the brutal bear market we’ve experienced.
A Little Background
The Stochastic Oscillator was developed by George Lane in the 1950s and is a momentum indicator that shows the current closing price relative to the high/low range of a defined period, the most common of which is 14 days.
There are three types of Stochastic: Fast, Slow and Full. We don’t have room to get into a full discussion of how these are calculated but suffice to say there are two lines that crossover each other to generate buy/sell signals and two ranges to indicate overbought or oversold.
In my work, I use the Full Stochastic Oscillator that uses the two previous mentioned lines plus an additional parameter to smooth out the momentum indicator. In the chart below, we can see the overbought range which is above 80 and the oversold range which is 20 or below.
The red line crossing over the black also generates buy and sell signals but these can be subject to whipsaws and in my view aren’t reliable by themselves. The best signals, in my view, resembles the one in the S&P chart below at the beginning of 2009 when the black line crossed over the red, the lines turned down and broke through the 80 level in a sharp descent just before the steep decline of early 2009 began in earnest.
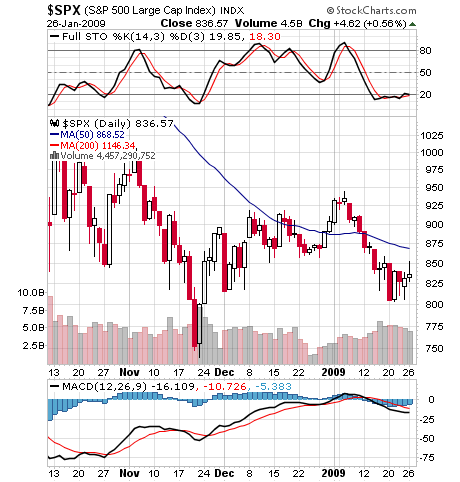
Now looking at real time in the daily chart of the S&P 500 above, we see that the full stochastic is at oversold levels (near or below 20) and that the lines are flattening out, indicating a sideways trend with the line oscillating between buy and sell; in other words a market with no commitment to move up or down.
So this would tell us that on the daily, the S&P 500 is oversold and trending sideways to down and this is confirmed by the MACD at the bottom also trending downward and on a “sell signal.”
Next let’s take a look at the same chart on the same day but on the weekly stochastic.

Here we see a slightly different story, with the stochastic lines in a mid position but on a definite sell signal with the black line crossing below the red and starting to curve down. This takes a longer term view and confirms the daily picture except for the MACD below indicating a contradictory signal with a weekly uptrend underway.
So, what can we make of this situation?
The S&P 500 has started an up move but still remains at much oversold levels and now is moving sideways. And on the candlestick chart, you can see that it has been in a 200 point trading range since October, 2008. An astute trader would be watching for an imminent up move because the weekly MACD is on a “buy” signal and the daily stochastic appears ready to make a turn up from much oversold levels.
In volatile markets, the daily indicator tends to be the most useful and reliable, but I always look for confirmation from other indicators like the weekly stochastic and MACD and where the stochastic is relative to the overbought and oversold zones.
When several of these indicators line up and point the same way, up or down, and the lines are moving out of one of the extreme zones, a reliable signal is underway and the trader can execute his move with a high degree of confidence in the outcome.
The nicest thing about the stochastic is that it can keep up with fast moving, volatile, trading range markets and offer the active trader a useful tool when other indicators have failed.
John Nyaradi is publisher of Wall Street Sector Selector, an online newsletter specializing in sector rotation trading using exchange traded funds.