How You Could Have Caught These 2 Big Moves
Today’s
PowerRatings article will look at how to combine our new 2-period RSI
indicator with PowerRatings to maximize your edge in the markets.
Click here to go to our new indicators page.
One of the most
popular technical indicators used by traders today is the Relative Strength
Index (RSI). RSI values range between 0 and 100, with 0 showing extreme
weakness and an oversold condition. Today we will focus on stocks with an RSI
below 2. These stocks have shown positive returns, on average, over the
next 1-day, 2-days, and 1-week later.
Click
here for more detailed information on RSI research conducted by Ashton
Dorkins and Larry Connors covering over 7 million trades from
Jan 1, 1995 to
June 30, 2006.
Let’s take a look at the 2-period RSI below 2
list from the close of 4/11/07:

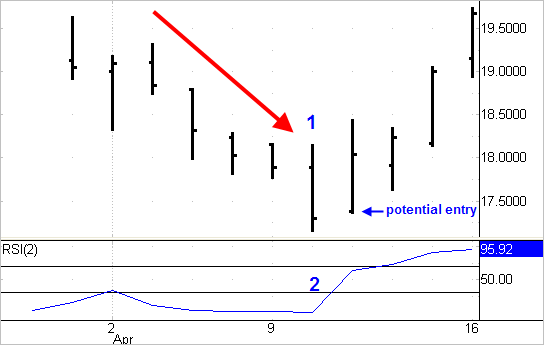
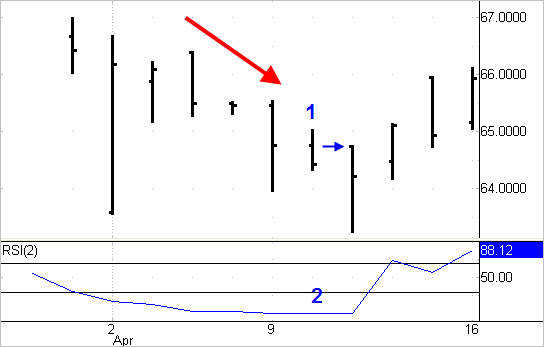
Here are a few examples from the
stocks listed above. The red arrow shows that the following stocks were
falling for consecutive days. Point 1 marks where each stock received a
high PowerRating. Point 2 marks where the 2-period RSI had dropped below 2. These were
all signs that
sellers were in control and that there was a lot of fear in these particular
stocks. Our historical research shows that oversold conditions like these
produce a historical positive edge and is incorporated into our PowerRatings.
These were all signals that made each of the
stocks good buys and could have been bought on the next day’s open (small blue
arrows). This strategy can be applied to stocks of all different price
levels.
If you would like to attend a free class which covers this
research and strategy further, please
click here
for the calendar of the upcoming online classes. Topics
covered include our latest research on
entries and exits, and
how to use PowerRatings with our new
Preferred Stock List.
For a free PowerRatings trial,
click here. If
you have any questions about PowerRatings or the new Stock Indicators please
feel free to email us or call 213-955-5858 ext 1.
G-iii Apparel Group Ltd.
(
GIII |
Quote |
Chart |
News |
PowerRating)

Safeco Corp.
(
SAF |
Quote |
Chart |
News |
PowerRating)

Obviously, results
like these do not occur every time,
but our quantified research clearly shows that the edges exist during extreme
oversold or overbought conditions.
Darren Wong
Associate Editor
Reminder: We are in no way recommending the purchase or short sale of these
stocks. This article is intended for education purposes only. Trading should be based on your own understanding of market conditions,
price patterns and risk; our information is designed to contribute to your
understanding.
