Intraday Fibonaccis Breached as the Selling Continues
Sell-offs traditionally across the global markets are far more violent then the buy-ups behind them. Today that mantra reigned king again in the FX markets, as the majors sold off strongly against the USD while the JPY pairs also suffered the same fate.
Taking a look at the Fibonaccis behind the most recent moves, we can see most of the gains the pairs made at the end of last week have been given back to the tune of 2/3’s or 3/4’s of their respective climbs. Sampling a few pairs from the frey, the EUR/USD has held up its own the best, or a better way of describing it would be, has lost the least, but lost nonetheless.
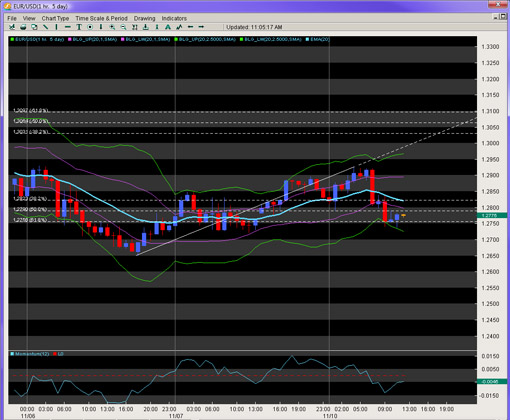
The chart below shows the EUR/USD on a 1 hour chart where the 61.8% fib of the most recent three cent gain has come under attack for the last few hours. So far, the garrison has held at the 1.2750 region where the last major intraday fib is parked. But notice how long it took to get from the highs to the lows – a whopping 4 hours, which took over 30+ to build. Thus the natural propensity of traders is still to sell the EUR/USD at this juncture.
Figure 1: EUR/USD 1 Hour Chart
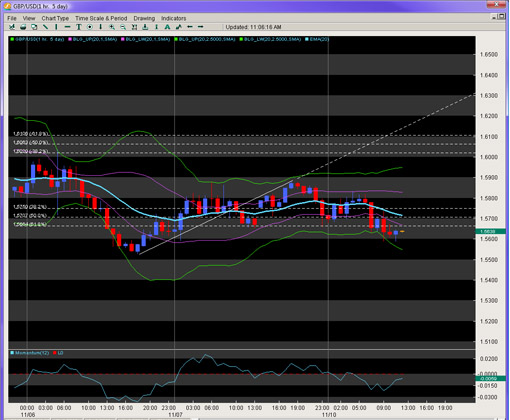
This natural tendency is further amplified by the weaker relative, the GBP/USD. This pair made a double top at last weeks high instead of making newer highs today, suggesting even further weakness. This has definitely been the weaker of the two pairs and as shown by the chart below, is treating the 61.8% fib as resistance and not support. This suggests a likely full reversal towards the mid 1.55 handle and a breach quickly testing the big figure just 50 pips below.
Figure 2: GBP/USD 1 Hour Chart
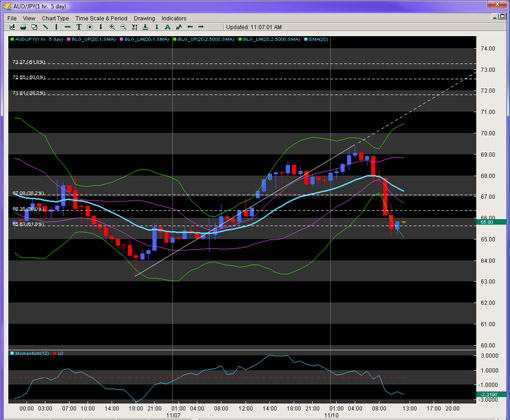
Lastly, the JPY pairs exhibited this similar behavior as they were hit the hardest today and the AUD/JPY being no exception. The 1 hour chart below shows how the pair also lost in a handful of hours at the end of the London session what had taken over a day to build. The impulsiveness of the move demonstrates how easy it is for the market to be selling these pairs instead of buying them, thus our bias is still up for the USD and JPY as a whole.
Figure 3: AUD/JPY 1 Hour Chart
Chris Capre is the Founder of Second Skies LLC which specializes in Trading Systems, Private Mentoring and Advisory services. He has worked for one of the largest retail brokers in the FX market (FXCM) and is now the Fund Manager for White Knight Investments (www.whiteknightfxi.com/index.html). For more information about his services or his company, visit www.2ndskies.com.