January rally overbought but marching on
Once again the latest week has been
fruitful for our favorite themes as well as leading to actual trades
in our US market trading strategy. The US and some EM markets are getting quite
overbought and could correct swiftly at any time here, but so far they continue
to march ahead. Investors and traders could book some small profits but we
suggest holding on and expecting volatility in the themes we like and in the
stocks highlighted by our strict criteria.
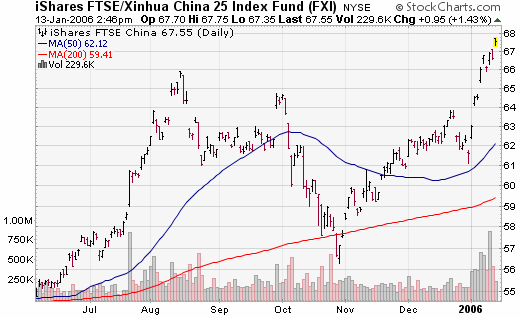
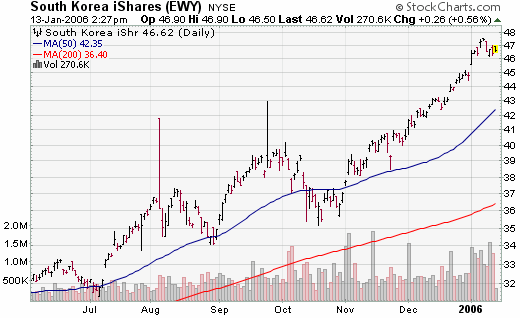
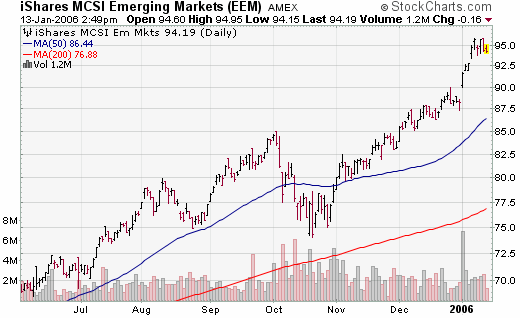
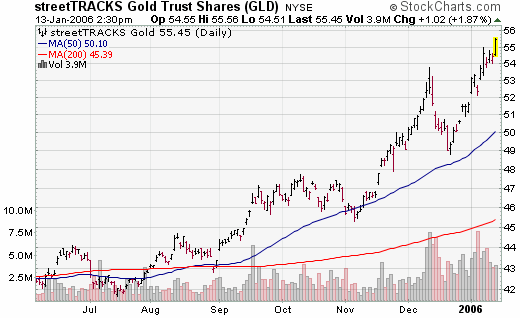
This week again saw new highs in many of our favorite themes:
Korea, Japan, EM’s, South Africa, metals shares, oil service, industrials,
resource plays, and China. Brazilian banks are consolidating but with sharply
lower rates expected ahead any corrections should be bought.
Our basic strategy of buying strictly only those stocks
meeting our rigid criteria and selling short those doing the same on breakouts
has had more new trades in the last month than in the six months prior.
Our model portfolio followed in TradingMarkets.com with
specific entry/exit/ops levels from 1999 through May of 2003 was up 41% in 1999,
82% in 2000, 16.5% in 2001, 7.58% in 2002, and we stopped specific
recommendations up around 5% in May 2003 (strict following of our US only
methodologies should have had portfolios up 17% for the year 2003) — all on
worst drawdown of under 7%. This did not include our foreign stock
recommendations that had spectacular performance in 2003.
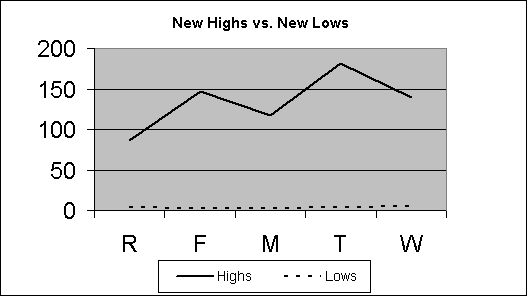
Over the past week in our Top RS/EPS New Highs list published
on TradingMarkets.com, we had readings of 86, 147, 117, 181, and 139 with 84
breakouts of 4+ week ranges, one valid trade in
(
RVSN |
Quote |
Chart |
News |
PowerRating) and close calls in
(
RAIL |
Quote |
Chart |
News |
PowerRating)
and
(
SHLM |
Quote |
Chart |
News |
PowerRating). This week, our bottom RS/EPS New Lows recorded readings of 4,
3, 3, 4, and 5 with 4 breakdowns of 4+ week ranges, no valid trades and no close
calls. The “model†portfolio of trades meeting criteria is now long
(
TRAD |
Quote |
Chart |
News |
PowerRating),
(
CIB |
Quote |
Chart |
News |
PowerRating),
(
BOOM |
Quote |
Chart |
News |
PowerRating),
(
TKR |
Quote |
Chart |
News |
PowerRating),
(
GG |
Quote |
Chart |
News |
PowerRating), and
(
RVSN |
Quote |
Chart |
News |
PowerRating). The environment is
getting a bit more positive and this is actually the most biased and highest
number of net longs via this strategy for some time.
While this rally may seem quite attractive to many short-term
traders, we are continuing to suggest more than normal caution and milder than
normal allocation to top global themes, and for investors to expect volatility
and less than optimum markets. There remain a number of big risks, and the bull
market is now older than average. We suspect that markets will continue to march
irregularly higher throughout the year but urge closely monitoring key risk
factors. A dollar or Yen crisis, a US consumption or housing crisis, or an
increase in Asian inflation are the primary concerns investors should watch.
Therefore cautious exposure, trading in and out with minor trends, is probably
yet again the best approach to 2006. We are completing our “2006 Investment
Roadmap†for traders and investors and hope to be able to offer this to
TradingMarkets.com clients soon. We believe it is one of the most definitive
guides to trading in the coming year and it includes our best analysis of global
themes, trends, and expectations for the year as well as what to watch for
changes in the environment. Ask for it!!
Mark Boucher
Mark Boucher has been ranked #1 by Nelson’s World’s Best
Money Managers for his 5-year compounded annual rate of return of 26.6%.
Boucher began trading at age 16. His trading helped finance his education at the
University of California at Berkeley, where he graduated with honors in
Economics. Upon graduation, he founded Investment Research Associates to finance
research on stock, bond, and currency trading systems. Boucher joined forces
with Fortunet, Inc. in 1986, where he developed models for hedging and trading
bonds, currencies, futures, and stocks. In 1989, the results of this research
were published in the Fortunet Trading Course. While with Fortunet, Boucher also
applied this research to designing institutional products, such as a hedging
model on over $1 billion of debt exposure for the treasurer of Mead, a Fortune
500 company.
For those not familiar with our long/short strategies, we
suggest you review my book The Hedge Fund Edge. Basically, we have rigorous
criteria for potential long stocks that we call “up-fuel,” as well as rigorous
criteria for potential short stocks that we call “down-fuel.” Each day we review
the list of new highs on our “Top RS and EPS New High List” published on
TradingMarkets.com for breakouts of four-week or longer flags, or of valid
cup-and-handles of more than four weeks. Buy trades are taken only on valid
breakouts of stocks that also meet our up-fuel criteria. Shorts are similarly
taken only in stocks meeting our down-fuel criteria that have valid breakdowns
of four-plus-week flags or cup and handles on the downside. In the U.S. market,
continue to only buy or short stocks in leading or lagging industries according
to our group and sub-group new high and low lists. We continue to buy new long
signals and sell short new short signals until our portfolio is 100% long and
100% short (less aggressive investors stop at 50% long and 50% short). In early
March of 2000, we took half-profits on nearly all positions and lightened up
considerably as a sea of change in the new-economy/old-economy theme appeared to
be upon us. We’ve been effectively defensive ever since, and did not get to a
fully allocated long exposure even during the 2003 rally.
