Monday Stock Movers: Narrowing Opportunities for Swing Traders
Stocks are off to a soft start on Monday, with the major indexes down a little more than 2% an hour after the opening bell.
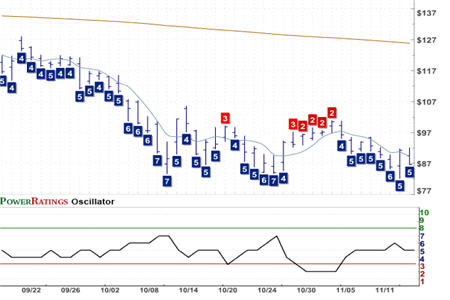
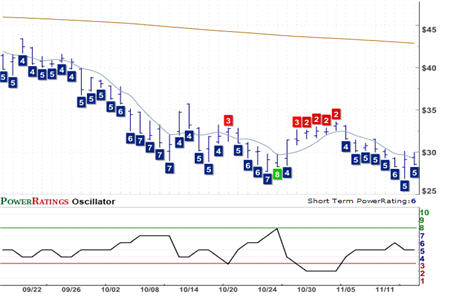
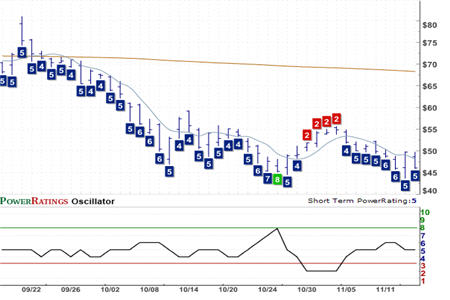
As the number of stocks above their 200-day moving averages grows small, the number of quality pullbacks in high Short Term PowerRatings stocks has dwindled as well. In the three PowerRatings charts below of three major market ETFs, you can see how few times stocks in general have been significantly oversold.
Because the first prerequisite we have for trading stocks when the major market averages are below the 200-day moving average is that those stocks themselves trade above their 200-day moving averages, we are able to stay away from many of the worst offenders when it comes to stock trading. Take a look at some of the most brutal performances in stocks over the past year. If traders had simply decided to divorce themselves from these stocks after they had fallen below the 200-day moving averages, they would have spared themselves a great deal of grief.
SPDRs S&P 500 Trust Series ETF SPY
(
SPY |
Quote |
Chart |
News |
PowerRating) Short Term PowerRating 5. RSI(2): 31.39

Unfortunately for more aggressive traders, this prerequisite means that there will be instances when there will be fewer trades.
While this is no doubt frustrating for traders who would like to be more active, the fact that there are so few high Short Term PowerRatings stocks above their 200-day moving averages is telling. Rather than bemoan the fact that there is little to do, swing traders might instead be comforted by the fact that our Short Term PowerRatings are, in a sense, helping keep swing traders out of trouble.
PowerShares QQQ Trust exchange-traded fund QQQQ
(
QQQQ |
Quote |
Chart |
News |
PowerRating) Short Term PowerRating 5. RSI(2): 29.35

One thing I hear from professional traders all the time – including recent Big Saturday Interviewees like Bill Kraft, Barry Ritholtz (this past weekend, click here) and, coming soon, Larry Williams – is that knowing when not to trade is as important as knowing when to trade.
iShares Russell 2000 Index Fund ETF IWM
(
IWM |
Quote |
Chart |
News |
PowerRating) Short Term PowerRating 5. RSI(2): 29.22

When the edges are there, traders need to be ready to take advantage of them. But when the edges are not there – when markets are more neutral than oversold or overbought, when the number of high Short Term PowerRatings trading above the 200-day moving average is slight – then, in effect, the good trades are not there either. And in such moments, the professional, sound strategy is to watch the markets, monitor where overbought and oversold levels are, and wait for quality opportunities to appear.
Does your stock trading need a tune-up? Our highest Short Term PowerRatings stocks have outperformed the average stock by a margin of nearly 17 to 1 after five days.
| Click here to start your free, 7-day trial to our Short Term PowerRatings! |
Whether you have a trading strategy of your own that could use a boost or are looking for a way to tell the stocks that will move higher in the short term from the stocks that are more likely to disappoint, our Short Term PowerRatings are based on more than a decade of quantified, backtested simulated stock trades involving millions of stocks between 1995 and 2007. Click the link above or call us at 888-484-8220, extension 1, and start your free trial today.
David Penn is Editor in Chief at TradingMarkets.com.
