Playing The ‘Lines And Levels’ With Fibonacci Retracements And Gaps
This daily chart marks a Fibonacci retracement from the “last major
move†(point “A†to “Bâ€)
and you can see the congestion at the 50% level and the
bounce from 61.8%. These are now support levels from which I can not
only swing or position trade, but also use for daytrading.
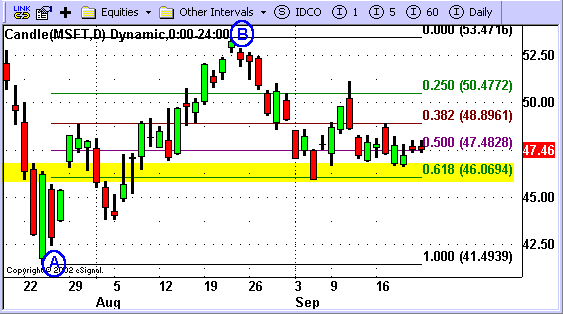
MSFT daily with Fibonacci
retracement
Even though I am a
daytrader a great majority of the day, time spent studying a one year daily
chart can prove invaluable. Take a look at
(
QLGC |
Quote |
Chart |
News |
PowerRating):
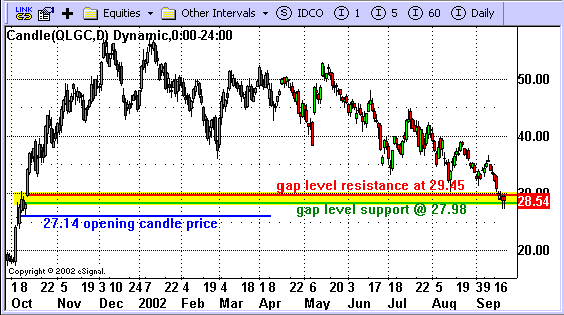
QLGC daily chart with gap levels
Never underestimate the
powerful support and resistance levels that gaps create. I mark all gap levels
on every market I trade (futures and stocks!) to see if the market will
react to these price levels. By now you know how much I respect the O/H/L/C of
the day as a “herd psychology†measuring stick…
Take a look at the next
chart to see how I used this information to manage my QLGC trade:
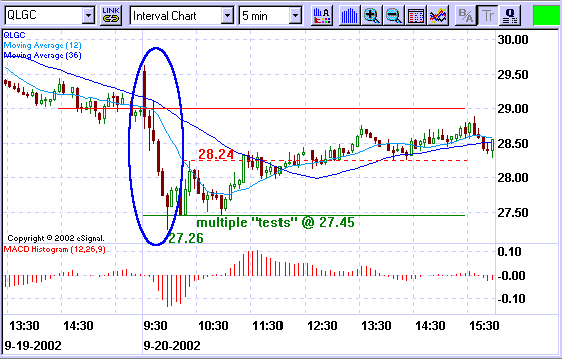
QLGC five minute
Here you see a few things,
first a sell-off right on the open. This was a *BS* sympathy move with
(
SUNW |
Quote |
Chart |
News |
PowerRating).
But I must respect it because EMOTION is reality.
The stock market is an arena of opinion. I am anxiously waiting to see if the
gap levels will be a play I can buy, once QLGC begins to trade at those levels.
With this approach in mind, let’s carry it through to our beloved
E-Minis…because after all, this is The E Files.
ESZ2 daily (24 hour chart)
From my daily chart
“homework†(and let me add I do not spend hours on this — stick to the
straightforward price levels: support, resistance, gaps, retracements,
psychological numbers) I can see that the 841.25 to 841.50 are going to be where
the buys are parked. If that fails to hold, I could look to 831.50 and 828.50. I
have also found myself marking the O/H/L/C of the gap candles which has really
given me some pinpoint accurate reversals and breakouts.
Try it!
The ESZ2 daily chart shows
how prices respected the 50% retracement for a bounce, then sold off past the
625! Remember these levels are not fixed buys rather “alerts†to watch just
like gaps levels. 840 will be a psychological decade number, along with a gap
candle level. So it will have my attention.
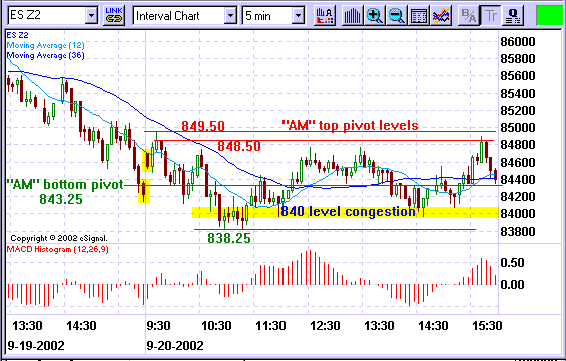
ESZ2 five minute
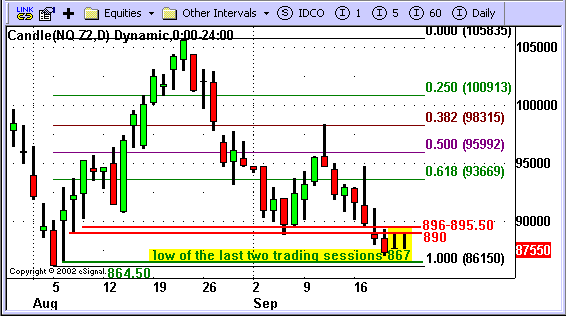
NQZ2 daily (24 hour chart)
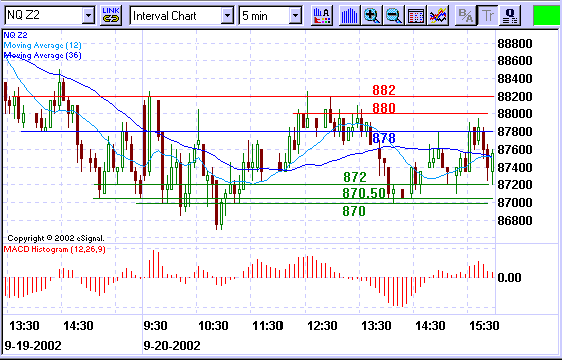
NQZ2 five minute
Of course I can use the
10×10 charts as well, but this week has seen prices fall completely off those
charts. And in cases like QLGC where the stock has made ten-month lows, I will
then rely on a daily chart!
Until next time,
Raghee Horner is a
private futures and stocks trader in Boca Raton, Fla. For 12 years she has
specialized in price action, charting, and trading psychology for intraday and
swing trading plays. Her focus is on trading the E-mini S&P 500, E-Mini Nasdaq
100 and the stocks she feels have particular synergy with those futures contracts.