PowerRatings Chartology: 3 Stocks for Swing Traders
News of job cuts from Sun Microsystems and disappointing retail sales are putting a wet blanket on Thursday’s massive intraday reversal.
For those who went long on Thursday, today is the truly difficult day as the opportunity for buyers remorse will likely prove overwhelming for many. Stocks are near their worst levels of the morning as I write, and it will be worth seeing if a little early profit-taking leads to higher highs later on in the trading day.
We are seeing a slight uptick in the number of quality pullbacks available for swing traders. Still no 9- or 10-rated stocks, but here are three, 8-rated names that investors may want to watch for further weakness and potential PowerRating upgrade that will mark them as worthwhile candidates for potential trades to the upside.
Thoratec Corporation
(
THOR |
Quote |
Chart |
News |
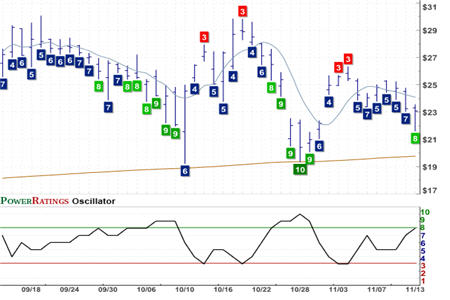
PowerRating) Short Term PowerRating 8. RSI(2): 9.33

Thoratec has made three significant pullbacks — including the current one — over the past several weeks. Each of these significant pullbacks has been accompanied by PowerRatings upgrades to 8 or higher. In both previous instances, it was the upgrade to PowerRating 9 that truly signaled the opportunity for a bounce — this was particularly the case during the late October pullback when THOR retreated all the way to its 200-day moving average, earning a Short Term PowerRating upgrade to 10.
Star Scientific Inc.
(
STSI |
Quote |
Chart |
News |
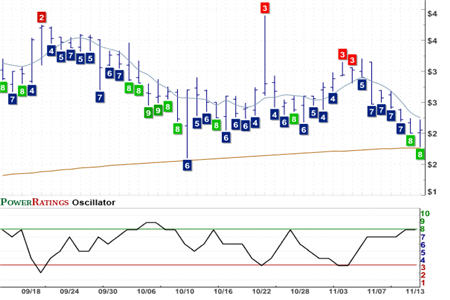
PowerRating) Short Term PowerRating 8. RSI(2): 22.89

The PowerRatings chart of Star Scientific shows instances of both high Short Term PowerRating pullbacks and low Short Term PowerRatings signals of potential reversal. One of the ways that swing traders can take advantage of Short Term PowerRatings, as I have pointed out before, is to look for low Short Term PowerRatings when stocks are trading above their 200-day moving averages. Often, when stocks received deep and dramatic PowerRatings downgrades above the 200-day moving average, a pullback is around the corner.
Steris Corporation
(
STE |
Quote |
Chart |
News |
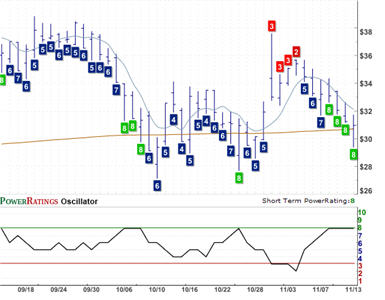
PowerRating) Short Term PowerRating 8. RSI(2): 1.06

Lastly, we’ll take a quick look at Steris Corporation’s PowerRating chart. One question we often get from traders is whether or not the 200-day moving average invalidates a potential trade. What happens if you buy a stock above the 200-day moving average and it falls below the 200-day moving average? Should you sell it?
The PowerRatings chart of STE shows one of example of why we stick with the stock. While the 200-day moving average is an important dividing line separating stocks that are stronger from those that are weaker, we have found that traders can stick with stocks they have bought above the 200-day even if they slip below it. We see in STE how this happened on two occasions since early October and in both instances, the 200-day moving average was no barrier to upward progress once STE bottomed and rebounded higher.
All three stocks in today’s report have Short Term PowerRatings of 8. Our research into short term stock price behavior since 1995 indicates that stocks with Short Term PowerRatings of 8 have outperformed the average stock by a margin of more than 8 to 1 after five days.
Does your stock trading need a tune-up? Our highest Short Term PowerRatings stocks have outperformed the average stock by a margin of nearly 17 to 1 after five days.
| Click here to start your free, 7-day trial to our Short Term PowerRatings! |
Whether you have a trading strategy of your own that could use a boost or are looking for a way to tell the stocks that will move higher in the short term from the stocks that are more likely to disappoint, our Short Term PowerRatings are based on more than a decade of quantified, backtested simulated stock trades involving millions of stocks between 1995 and 2007. Click the link above or call us at 888-484-8220, extension 1, and start your free trial today.
David Penn is Editor in Chief at TradingMarkets.com.
