Quantified Trading Strategies for Short Term Traders: Finding Edges in Stocks and ETFs (AAPL, SPY, FAS)
Everyone is looking for an edge in the marketplace. In my opinion, they exist, especially over the short term.
When prices get extended too far to the downside, they tend to snap back (this is known as “reversion to the mean”). The further they pullback, the larger they snap back.
Is this true for every single pullback? No! But when we look at tens of thousands of pullbacks going back decades, we see a decided edge over the short-term. Meaning these stocks and exchange-traded funds (ETFs) tend to do better than an entire universe of stocks and ETFs does over the same period of time.
The more efficient you are at finding and quantifying these pullbacks, the better your chances of success.
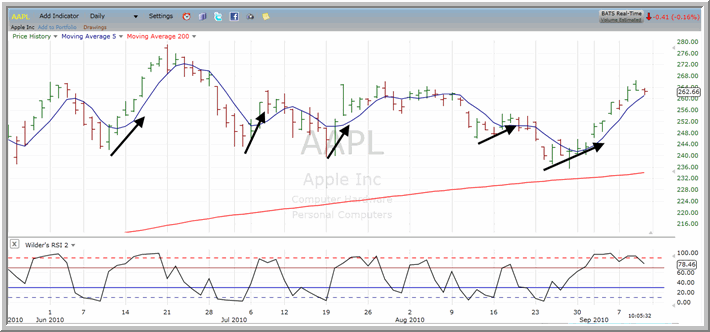
Above: Pullbacks in shares of ^AAPL^ over the past several months have been excellent opportunities for traders to take advantage of temporary weakness in a sideways market.
Many people believe that all they need to do is properly identify a time than an edge exists and the money will flow from there. This scenario goes on all day long. Everyone who goes on television or is quoted online or in print believes the stock or ETF they are discussing has an edge. Maybe it does (though we strongly believe those edges should be quantified ahead of time – otherwise, in our opinion, it’s just “guessing”, something we don’t want to be doing when money is stake.)
But as important as identifying when to enter with an edge, you need to know when to exit. Edges usually exist for only short periods of time. Get out too soon and you’ve diminished the edge. Hold the position too long and the edge begins to disappear.
What is the key time to exit a position that has a “quantified edge”? We’ve found its ideally 3-7 trading days. But traders can do better than this. Time exits are static and we want to be dynamic (meaning we’ll let price get us out, not time).
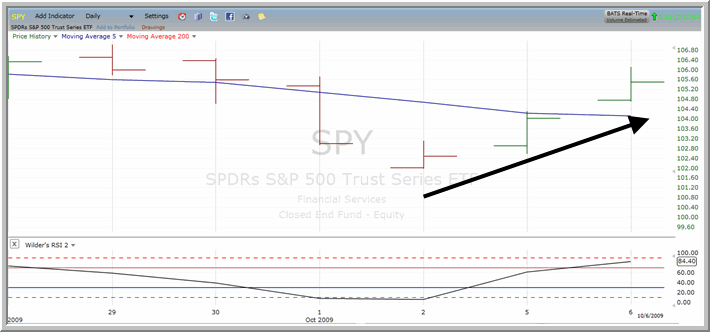
Above: As with stocks, pullbacks in exchange-traded funds also can provide opportunities for short term traders to take advantage of market extremes. Here is a pullback in the ^SPY^ from the perspective of a high probability, mean reversion trader.
So, what are some of the better ways to use price to exit trading positions?
There are a few but our favorite (which have been quantified) are crosses above the 5-day simple moving average (meaning once the stock or ETF has closed above its 5-day moving average, it is a signal to exit the position the next day).
Another favorite that we developed a few years ago and still use is waiting for a stock or exchange-traded fund’s 2-period RSI to close above 70 (65-75 is a good range with 70 being in the middle).
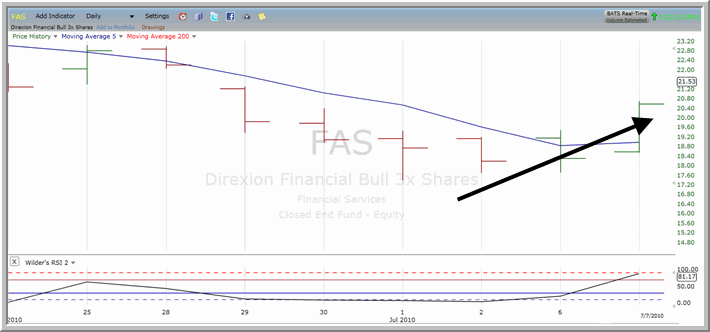
Above: Although the specific trading criteria for trading leveraged exchange-traded funds differs in some important respects from non-leveraged ETFs and stocks, the same basic principle of buying oversold markets and selling them into strength applies – as shown in this example with the ^FAS^.
For each of these exits to occur it means that the stock or ETF has rallied off its lows and buying pressure has pushed prices higher. Depending on the entry edge, you can trade set-ups which have been profitable over 70% of the time going back more than a decade. With many widely-traded ETFs, the accuracy rates have been even higher.
The first key piece to successful trading in the short term is buying on pullbacks which have shown a historical edge, and then exiting when prices rally to above their 5-day moving average or when the 2-period RSI closes above 70. The better you can do this and the more often you can do this, the more likely you will be successful as a short term trader of stocks and exchange-traded funds.
Have you seen The Machine? Taking high probability, quantitative trading and investing to a whole new level, The Machine is the first financial software that lets traders and investors build quantified portfolios of backtested mean reversion and trend-following strategies. If you own an IRA or manage investments in excess of $250K, then you owe it to yourself to attend the next free, online presentation on The Machine by TradingMarkets founder and CEO, Larry Connors.
Find out how real-life professional investors and money managers are using The Machine in our new interview with investment advisor, Darrell Kay here . Then be sure to click here to save your spot at Larry’s upcoming, free webinar on The Machine.
Larry Connors is CEO and Founder of TradingMarkets.com and Connors Research.