Short Term Trading Strategies That Work: Selling the Buying in GOOG, MSFT, WMT
When the going gets tough, the tough get going. And when stocks become overbought below their 200-day moving averages, high probability traders are among those best positioned to take advantage when overbought conditions reach extreme levels and the selling that follows almost inevitable.
These are the kind of edges that high probability trading strategies, strategies based on those in the book by Larry Connors and Cesar Alvarez, Short Term Trading Strategies That Work, can provide short term traders every day. By only focusing on those markets where historical edges are strongest, the high probability trading strategies in Short Term Trading Strategies That Work provide traders with what they need to know in order to find the best stocks – and exchange-traded funds (ETFs) – to trade every day.
Consider just one piece of research from Short Term Trading Strategies That Work. Larry and his team at Connors Research discovered that stocks that are overbought below their 200-day moving averages tend to underperform in the short term. The tool they used to measure “overbought” was (and is) the 2-period RSI. And by “short term” the research used a look back period of under a week.
To quote directly from Short Term Trading Strategies That Work:
“The average returns of stocks with a 2-period RSI reading above 90 underperformed the benchmark, 2-day (0.00), and 1-week later (-0.07) … The average returns of stocks with a 2-period RSI reading above 95 underperformed the benchmark and were negative 2-days later (-0.03%) and 1-week later (-0.07).”
Further conclusions – including the potential implications from this research – are a large part of Chapter 9 in Short Term Trading Strategies That Work. For now, consider the recent performance – or, better, underperformance – of stocks like ^GOOG^, ^MSFT^ and ^WMT^ shortly after becoming overbought below the 200-day moving average.

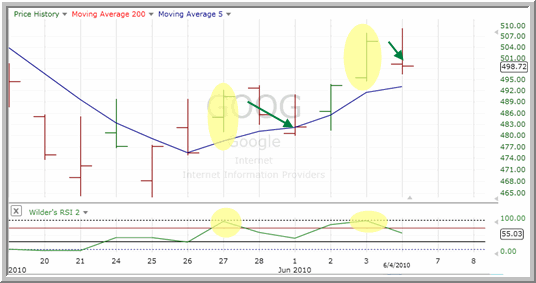
A move lower by more than 1% in Google after shares below the 200-day moving average climbed into overbought territory.

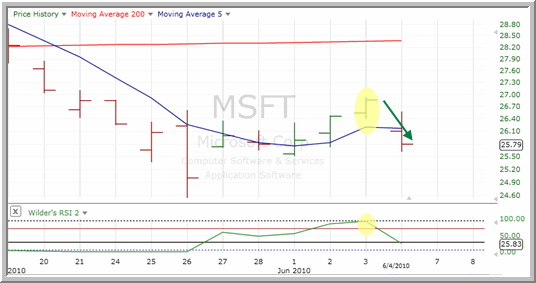
A pullback of almost 4% took shares of Microsoft lower on Friday after a one-day close in overbought territory below the 200-day.

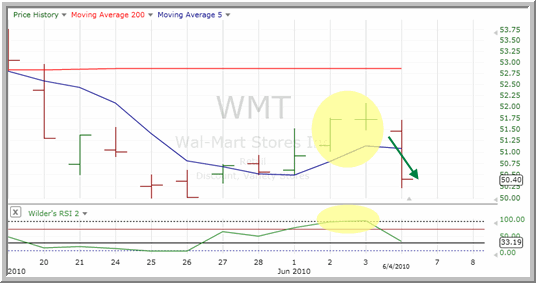
Here, two consecutive closes in overbought territory below the 200-day, helped send shares of Wal-Mart lower by well over 2% in trading on Friday.
In each instance, overbought conditions below the 200-day moving average were signals that the bounce in each stock was potentially overdone, and a short term reversal back to the downside likely. For owners of these stocks, this kind of information could help determine when to add or when to trim back a holding. But for short term traders, the opportunities to sell short stocks as they become overbought below the 200-day moving average could become the “new normal” for short term traders should another bear market take hold.
Short Term Trading Strategies That Work could change the way you look at short term trading, and may be the first step toward making 2010 your best trading year ever. Click here to learn more about Short Term Trading Strategies That Work and pick up your copy today – now in softcover.
David Penn is Editor in Chief at TradingMarkets.com.
