Still In Trading Range
Last
week we had some low-volume but decently broad rallies followed by slightly
higher-volume declines in fits and starts.
There appears to be a minor rally taking shape off of last week’s
double-bottom test in
the general market. Some
breadth features are improving, but volume is still poor and breadth is not
strong.
In other words, the trading range continues. We
did indeed get two longs and two shorts this week, and we even had to pass on a
third long because of our defensive rule. Is
the trading range finally leading to clearer strong and weak groups that offset
each other in terms of moves in the major averages, but help propel our
long/short portfolio forward? We
can only hope that this is the case.
Let’s
look at Top RS/EPS New Highs versus Bottom RS/EPS New Lows breadth.
Thursday showed 22 new highs and six new lows, Friday 31/3, Monday 31/21,
Tuesday 27/9 and today 28/8. So we
have the first week in a long time where more than 20 new highs occurred each
and every day. New lows showed just
one day with 20 or more issues. Breakouts
were about even, though with nine new high breakouts of four-plus-week consolidations
and eight new low breakdowns of four-plus-week consolidations on these lists. We
also got two valid breakdowns in stocks meeting our downfuel criteria in CGA and
BTY. All in all, my interpretation
of these numbers is that the long-side is improving, but a select few groups are
still breaking down. It remains a
not very good environment for aggressively adding longs and a pretty poor
environment for aggressively adding shorts.

Our
overall allocation remains low but is increasing.
We are now around 46% long (including open profits) and 55% short for
aggressive accounts using leverage (23% long and 27% short for unleveraged, more
conservative accounts). Last week,
our longs fell an average of 1.96% (and with 46% allocation, this subtracted 0.9%
from our overall portfolio), while our shorts rose 0.8% on average (and with 55%
allocation, this subtracted 0.44% from our overall portfolio), giving our overall
portfolio a loss of about 1.24% on the week, and leaving us with around a 76%
gain on the year (2.4% off of new equity highs) on a 12% maximum drawdown so
far. Conservative investors not
using leverage show about half these gains and drawdowns.
For
those not familiar with our long/short strategies, we suggest you review my
10-week trading course on TradingMarkets.com, as well as my book “The
Hedge Fund Edge” and course “The Science of Trading.”
Basically, we have rigorous criteria for potential long stocks that we
call “up fuel,” as well as rigorous criteria for potential short
stocks that we call “down fuel.”
Each day we review the list of new highs on our “Top RS and EPS New
High list” published on TradingMarkets.com for breakouts of four-week or
longer flags, or of valid cup-and-handles of more than four weeks.
Buy trades are taken only on valid breakouts of stocks that also meet our
up-fuel criteria. Shorts are
similarly taken only in stocks meeting our down-fuel criteria that have valid
breakdowns of four-plus-week flags or cup-and-handles on the downside.
We continue to buy new signals and sell short new short signals until our
portfolio is 100% long and 100% short (less aggressive investors could stop at
50% long and 50% short). In early
March we took half-profits on nearly all positions and lightened up considerably
as a sea-change in the new economy/old economy theme appeared to be upon us.
We’ve been effectively defensive ever since, and continue to be.
Upside
breakouts meeting fuel criteria (and still open positions) so far this year are:
AC @44 w/46.5 ops; GBCB
@30.38 w/33 ops; AC
@51.44 w/44.5 ops (we now have a double position in AC, as this was a pyramid);
and this last week we had valid pattern breakouts up in stocks meeting our
up-fuel criteria (see 10-week trading course):
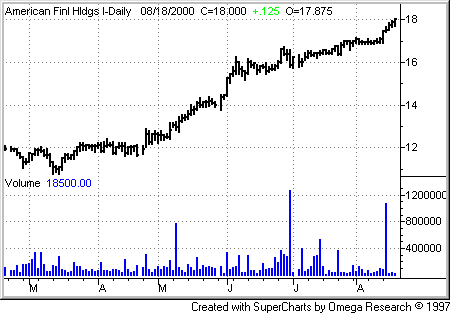
AMFH @17.44 w/16.5 ops; and DYN @85 w/72 ops;
(TNL also met criteria, but we didn’t take because it came after two prior
trades and we’re only taking two trades a week — if some of you took this one and
not one of the other two, it should be a good trade).
The average gain in these stocks from breakout points of entry to
Wednesday’s close is 67%, substantially outperforming the NASDAQ, DOW, and
S&P for the year to date. Continue
to watch our NH list and buy flags or cup-and-handle breakouts in NH’s meeting
our up fuel criteria.

On
the downside, this year we’ve had breakdowns from flags (one can use a down
cup-and-handle here as well) in stocks meeting our down-fuel criteria (and still
open positions) in: @13.44 – now use 12 ops; ABF @17
– now use 16 ops; PKS
@18.13 – now use 16.75 ops; and AMZN @31.38 – out on 38 ops;
SONE @18.13 w/21 ops; and
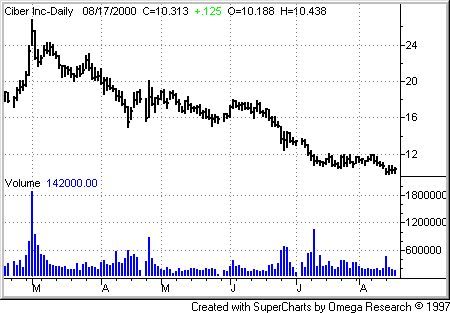
last week we had two valid breakdowns in down-fuel stocks: CGA
@ 11.88 w/13.25 ops; and BTY @125.19 w/145 ops.
These shorts are down over 48% from breakdown levels on average so
far this year (before current prices or exits).
Continue to watch our NL list daily and to short any stock meeting our
down-fuel criteria (see 10-week trading course) breaking down out of a downward
flag or down cup-and-handle.
If
next week we get more long-side breadth and a couple of follow-through days, we’ll
be able to take our defensive posture off on the long-side.
Until then, both sides of the market are not worth strong allocation.
Remember that we’ve had a good runup and could experience a correction in
the return of our strategy at any time. Nonetheless,
we’re doing quite well this year so far given the market environment — so let’s
stick religiously with our strategy and let it tell us how aggressively to
allocate and to what vehicles on what side of the market.
Enjoy the ride. Remain
defensive and cautious during the week ahead.
