Stock Market Momentum Indicator: A Trading Tool for Tough Markets
In today’s tough investing environment, every investor and trader needs as many things as he or she can get to level the playing field and give you the best chance for success.
One tool that I have found to be most valuable in achieving Year-to-Date profitability that for the two portfolios I manage is Momentum.
Click here to order your copy of The VXX Trend Following Strategy today and be one of the very first traders to utilize these unique strategies. This guidebook will make you a better, more powerful trader.
Momentum:
Momentum is most easily defined as the acceleration rate of a stock’s price. ETFs or stocks that are accelerating rapidly often times continue that directional trend for sometime and become tradable trends, and so momentum can be a valuable trading tool in your arsenal.
Momentum can be measured in different ways and over different time periods. The easiest way to measure momentum is by using moving average crossovers.
The chart below depicts a 50/200-day moving average crossover represented by the red and blue lines in the price chart. This is a commonly used combination to determine market direction. When the short term blue line moves above the long term red line, the stock’s momentum is positive, and conversely, when the short term line moves below the long term line, the stock’s momentum is negative.
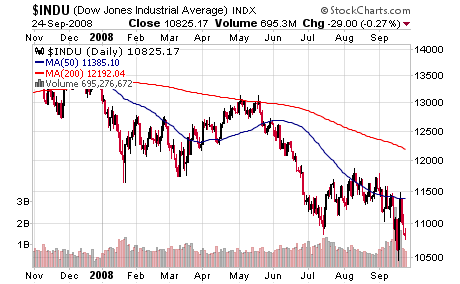
These crossover points are generally considered to be “buy” or “sell” points as the short term line moves above or below the long term line. In the chart above, the Dow Jones Industrial’s short term blue moving average has moved below the long term red line to indicate a “sell” signal. You can use any length of time you want to plot moving averages ranging from minutes to years but one must be consistent and understand what the moving averages are telling you.
Momentum is only valid as a trading tool if your time horizon and trading style match the momentum indicator you’re using. Therefore, if you’re using short term momentum, your indicator would only be valid for short term price changes and so your trading horizon should be short, as well. Conversely, if you’re using longer term momentum indicators, say monthly, changes in momentum would indicate price movement for periods of one to several months.
A second way to measure Momentum is to use a widely followed indicator, MACD which is shorthand for Moving Average Convergence Divergence, an intimidating phrase that describes the combination of a trend following and momentum indicator. In other words, MACD is both a trend indicator and a momentum indicator and so by studying it, one can determine if a security is in an uptrend and if its momentum, or price velocity, is accelerating or declining.
In this example of DJIA, MACD, on the bottom of the graph, is declining and below the “0” line and so prices are in a downtrend. Also, the short term blue line has moved below the long term red line to indicate a downward trend in prices.
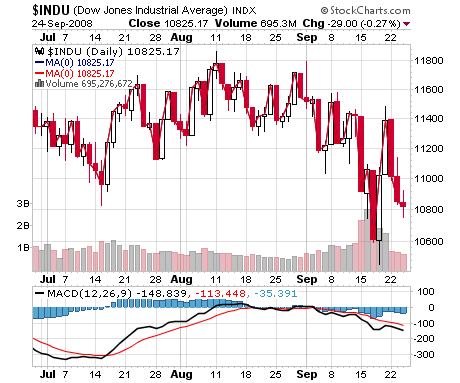
When you combine Moving Averages with MACD, you get a good picture of a stock’s or ETF’s direction, trend and momentum. And, this picture can help improve your chances of picking a winner and having a successful investment over the short or long term.
John Nyaradi is publisher of Wall Street Sector Selector, an online newsletter specializing in sector rotation trading using exchange traded funds.