Support and Resistance Lines – Are They Still Valid?
As stocks continue swimming in the inauspicious pool of multi-year lows, the notion of how to read charts has become somewhat passe – even within technical trading circles. The crash of 2008 has effectively hamstrung the use of common chart reading tools like support and resistance lines.
Indeed, it seems like every time a support line has been drawn in the sand, that line gets obliterated by sellers motivated by client redemption orders, preset stop losses or, in many cases, just plain panic.
Click here to order your copy of The VXX Trend Following Strategy today and be one of the very first traders to utilize these unique strategies. This guidebook will make you a better, more powerful trader.
The proclivity for calling an end to common notions like support and resistance as ways to help explain – and hopefully predict – current and future market moves seems fashionable given the dispirited market milieu.
But before you reject what some are calling quaint notions of support and resistance, let’s first do a little review of just what these are and why they are critically important to understand.
What Are Support and Resistance Lines?
On a technical chart, support and resistance lines appear as thresholds to price patterns. They are the respective lines where prices stop moving down or up.
A support line (green line in chart below) shows the level that a stock’s price generally will not fall below. It marks the price level where there is adequate demand to stop, and possibly to turn a downtrend higher.
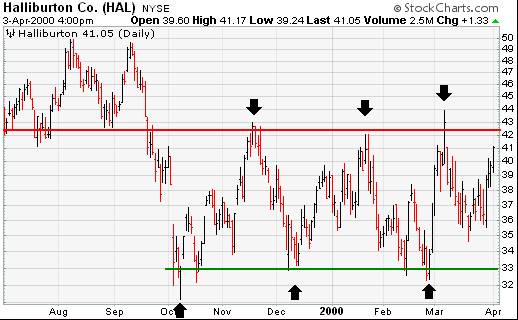
A resistance line (red line in chart) is the level above which a stock’s price typically will not rise. It indicates a price level where an adequate supply of stock is available to stop and – possibly, for a time – fend off an uptrend in prices.
Why Do Support and Resistance Lines Occur?
A stock’s price is established by supply and demand. Bulls buy if they think a stock is priced too low. Bears sell if they believe prices have peaked. Bulls bid up the price by increasing demand; bears take it down by increasing supply.
When the bulls and bears find a price point that they can both agree upon, the market finds a balance. Unfortunately, fear of the unknown is still lurking around every market corner. The damage that could be sustained to balance sheets via losses from credit default swaps; the uncertainty over the government’s bailout plans, and the uncertainty of what the presidential election will bring have conspired to keep buyers away from equities – and that has really upset market balance.
When prices trend upward – a seemingly alien incident these days – a point occurs at which the bulls begin to pull back and the bears become more aggressive. It’s at this point where the market usually balances along the resistance line.
When prices trend downward, the market finds balance along the support line. As prices decline toward that support line, buyers become more prone to buy and sellers become less inclined to sell their stocks. The support line marks the point where demand takes precedence over supply and prices will not fall below that support line.
As we’ve witnessed lately, prices frequently break through support lines. They also routinely break above resistance lines, although we haven’t witnessed much of that this year.
A breaking through of the resistance line indicates that the bulls (buyers) have won out over the bears (sellers). The bulls remain determined to bid up the price of the stock higher than previous highs. Once the resistance line is broken, another will be created at a higher level. Of course, the reverse is true for a support line. That’s when the bears (sellers) win out over the bulls (buyers) and send a stock tumbling.
The interesting thing about support levels is they can transform into resistance levels. On the flip side, resistance levels can also transform into support levels. After prices break through a support level, traders may try to limit their losses by selling the stock, which often pushes prices back up to the line which now becomes a resistance level.
Why Are Support and Resistance Lines Important?
Technical analysts frequently say that the market has a “memory.” I’ve spoken with many traders lately who wished they didn’t have their own faculty of memory, but that is another story.
In terms of the market, support and resistance lines are key components of that market memory. Investors – and particularly traders – tend to remember previous support and resistance levels, and that gives these levels psychological importance. When a stock changes its price level rapidly, day after day, the public will buy and sell at widely divergent price points and there will be no agreement in such changing prices. However, when prices trade within a fairly narrow range for a period of time, traders begin to remember that specific price.
The longer prices stay in a given trading range, and the greater the volume traded within that range, the more important support and resistance levels becomes. I liken it to a political campaign, where the longer you hear each side’s sales pitch, the more pronounced it becomes in your mind.
Well, traders are not immune to the pitch of a stock’s behavior. The longer it stays in a trading range, the more it becomes imprinted in traders’ minds. Many experts maintain that previous support and resistance levels can be used as “target” or “limit” prices when the market has traded away from them. And while I think this is true, the recent violent decline in equities has now forced many traders to effectively rethink their strategy.
Now, it’s not unusual for prices to move below or above a support or resistance level for very short periods of time, especially during a trading period with a lot of volatility. But the unprecedented volatility we’ve seen in the markets over the past two months effectively wipes out traditional measures of support and resistance.
This notion of obsolescence in former support and resistance levels due to the crash of 2008 brings us back to our original question of whether the concepts of support and resistance lines are still valid.
The answer is they are more valid than ever, conceptually, yet because of the market meltdown we’ll have to in-effect rewrite the record books. The widespread declines of late have forced us to wait until a new floor has been established, i.e., support, in equities. Many traders thought that a new floor was established back when the Dow was at 10,000, and then again at Dow 9,000. Well, so much for that.
Of course, the real support level won’t really be known until after the fact, but your job as an individual investor is to understand that out of the winds of Schumpeterian creative destruction come new paradigms of understanding, and new models of market behavior.
That behavior will still be translated in the market, and it will still be reflected by support and resistance levels on a stock chart.
Make no mistake about it, support and resistance levels are still very much important tools for the technical analyst. By understanding and rethinking this market in terms of its new support and resistance levels, you’ll put yourself in a position to make correct decisions with either your stock or your option plays.
Ken Trester started trading options when the first exchanges opened in 1973. He has been a computer science professor at Golden West College in Huntington Beach, CA, where he also taught a course on stock options trading. Ken is also widely quoted in publications such as Technical Analysis of Stocks & Commodities and Barron’s.