The Historical Patterns of Sideways Markets
Hi Austin,
You had replied to a thread about TF volume on Elite Trader last summer. I also read your blog and commentaries online. I was wondering if you had an opinion as to the future of TF. I have an automated trading system that uses a scalping technique, and as you can probably guess, the plunge in volume after last March/April has been detrimental to my system’s performance. Do you think volume will come back? Are traders on the sidelines for now, or is this a long time trend? Does it have to do with decreased credit in the financial system? Any opinions you may want to share would be greatly appreciated. [Jose]
Excellent questions, Jose. Thank you for asking those… and to everyone else who has asked or wondered the same things for quite some time now. I guess the best way for me to answer all that is by recapping past experiences of my own.
History Repeats?
The wild years of 1999 through 2002 saw unprecedented volume and volatility in stock markets. New all-time highs were followed by monumental crashes, and big price swings in between. Pretty much the same thing witnessed from year 2007 through mid-2009. Years 2003 through 2006 saw waning volume and volatility in all stock markets. VIX levels dropped from historical highs to decades’ lows near readings of 11 and 10 on the index scale. Intraday ranges for the S&P 500 e-mini (ES) were commonly less than ten index points total, often six or seven index points total intraday range from open to closing bells.
That sounds a lot like mid-2009 through the present time, first few days of Jan 2010 here and now. Does that automatically mean stock index markets are poised for years’ of waning volume and volatility?
Figure 1: Dec 2008 – Jan 2009 ES
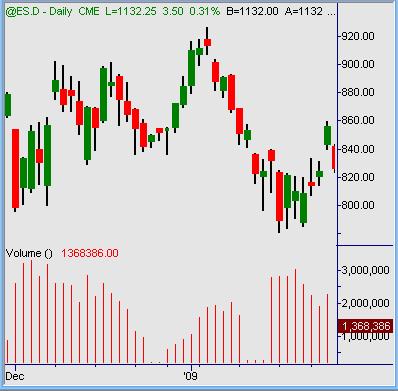
Figure 2: Dec 2009 – Jan 2010 ES
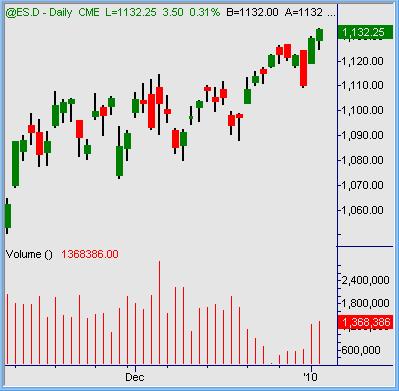
I’d say that remains to be seen. January tends to continue December’s usual wane in volume until the middle or latter part of the new month. Once MLK holiday break has passed and earnings season starts, market players who actually push the tapes resume the activity that actually pushes the tape. For now there are program bots and small-size traders pushing markets sideways like jell-o wiggling on a plate. Lots of wiggles and jiggles, no real directional movement. This past month of December 2009 (lower chart) had noticeably lower ranges and lots of gaps (holes) visible in that chart. Volume waned from early Dec spike highs of 2+mil ES contracts daily dribbled down to 500k sessions around the holiday season. Still waiting for the first 2mil ES contracts session to unfold in 2010.
Since 2004
But back to the specific question at hand. What to expect from TF intraday volume going forward. Having traded the Russell 2000 e-mini futures since mid-2004 myself, I’ve witnessed 5 1/2 years of market cycles and evolution in that specific market. The early days in 2004 saw ER2 (TF predecessor) average volume somewhere near 30k to 50k contract daily. Pretty similar to what we have in the TF now. It grew to average 200k contracts and even 300k to 400k contracts daily at its zenith. Organic growth was stunted when the index migrated listing from CME to ICE exclusively. During that period of transition, stock markets went totally haywire from historic highs to subsequent lows and back. So many variables involved there, it’s like analyzing strands of cooked spaghetti dumped on a plate in front of us.
The first few sessions of 2010 have customarily started with extremely low volume and no intraday price ranges at all. In the past we’ve typically seen that pick up from the second half of January onward. Whether that seasonal pattern continues or abates this year depends on outside factors, too.
Following the wild price swings from mid-2008 through mid-2009, stock markets have pretty much gone straight up on waning volume. The higher they go, the more volume continues to ebb. That suggests everyone who wanted to be long at these levels already is. Buying demand has dried up and died. But no one is selling. To state the obvious, that is what we see in present charts. No one who matters to the market is doing anything.
Volume and volatility go hand in hand. Markets do not consistently cover large ranges intraday on low volume. Markets definitely do not move through large oscillations and swings intraday with low volume. They either bleed in a deliberate direction or string sideways in listless fashion. It takes lots of trading volume to push the tapes up, down or around. Lots of volume creates lots of activity… stops and profit objectives being hit for multiple groups of people. That is in essence the creation of volatility: spurring many = more traders to make active buy/sell decisions. The actions taken by many traders in various groups of buy/sell decisions is what creates elevated volume flow.
Figure 3: Dec 2009 – Jan 2010 ES
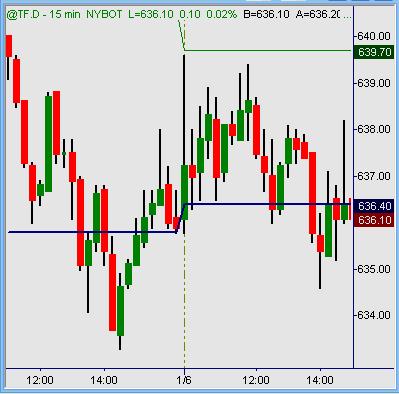
None of that exists in stock markets right now. Complacency reigns supreme. Complacency has gradually taken hold of stock index markets since the middle of 2009. Our proverbial frog in the frying pan finds himself cooked. Trading systems, methods and tactics geared toward normal to high volume & volatility don’t work because they cannot work without necessary market ingredients. For example, the Wednesday Jan 6th TF session held inside a 6 index-point total range with well under 100k contracts turned. No range, no volume, no volatility. No market movers active in these markets at all.
Until When?
That’s the question everyone asks. The problem is, no one on this earth can possibly know for sure. What it will take is some type of unknown development or event to shock markets out of their doldrums. If priced to perfection, it requires an adjusted sense of valuation to spur traders back in action. That could be earnings-related, economy related or a global instance that surprises stock markets. Until something(s) appears out of the blue, we can expect more of the same to continue.
The question asked of when, what and why concerning volume wane in the TF specifically over the past year is due to reasons stated above. What comes next remains impossible to know. We can assume that trading volume will once again rise to prior normal and even historic levels at some point ahead. That’s of little comfort knowing what weeks or months ahead should be when running automated systems spitting out live trade signals today.
Summation
Without question there are countless traders on the sidelines right now. Many if not most traders still active are working reduced sizes from normal to combat sideways chop and poor reward to risk conditions while tapes trudge sideways. So we could say that even many of those traders are semi-sidelined, too. Boils down to a matter of everyone sitting, watching & waiting for someone else to make their move. No one will press any trade size (volume) consistently until given reason to believe markets can move further in favor than probable to chop against. Until enough market movers get moving, status quo remains in force. What the near-term and mid-term future holds, no one really knows.
Austin Passamonte is a full-time professional trader who specializes in all commodity markets. Mr. Passamonte’s trading approach uses proprietary chart patterns found on an intraday basis. Austin trades privately in the Finger Lakes region of New York. Click here to visit CoiledMarkets