This Indicator Alerted Us 2 Days Before a 20% Drop
Each day,
TradingMarkets publishes
7 Trading Ideas for Today, a selection of stocks from our daily indicators. TradingMarkets
Stock Indicators are based upon our latest quantitative research, and
highlight trading edges backed by our database of more than 7-million historical
simulated trades.
On Friday,
March 9, Daktronics
(
DAKT |
Quote |
Chart |
News |
PowerRating) was
the candidate from the
5+ Consecutive Up Days
list.
These are stocks that have closed up for five or
more consecutive days and are trading below their 200-day moving average. Our
research shows that stocks trading below their 200-day moving average that close
up for five or more days have shown negative returns, on average, 1-week later.
Historically, these stocks have provided traders with a significant edge.
Historically, these stocks have provided traders with a significant edge.
The
TradingMarkets mantra is to “buy weakness, sell strength,” and that is exactly
what you could have done here. While most investors would have been looking for
DAKT to break through resistance at the 200-day moving average, TradingMarkets
was more concerned with overbought conditions.
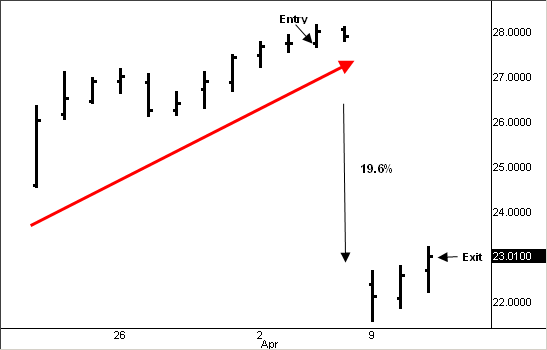
1-day later, DAKT was +1.2%
2-days later, IAAC was +0.5%.
5-days later, IAAC had declined -17.1%.
This is an example of an edge
that took less than the full 5 days to unfold. On the second day of the trade,
DAKT warned of Q4 weakness in earnings and revenue after the market closed; DAKT
gapped down the next day nearly 20%.

Obviously,
results like these do not occur every time, but
our quantified research clearly shows that the edges exist during extreme
oversold or overbought conditions.
Check out our
latest quantified research articles
here. If
you don’t already have a TradingMarkets subscription,
click here
for a free 7-day trial. Check back daily for more 7 Trading Ideas for Today,
and develop your own watchlist of stocks with historically-backed edges.
John Lee
Associate Editor
