Up The Down Ladder
Instead
of 1.5 to 2.0 Volatility Band gap downs
on the opening due to emotional selling, we got Trap Doors, many of which
reversed on the third or fourth bar.Â
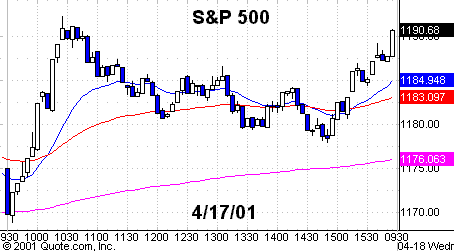
For example, check the S&P 500
(
SPX |
Quote |
Chart |
News |
PowerRating) five-minute chart which I will include tomorrow. You
got a three-bar pattern entry on the Trap Door with entry above the 1172.31 high
and this run took it up almost 20 points to 1192.25. This was a 2.24 extension
of the Trap Door leg down and is the most common extreme extension.Â
From there, you got a 1,2,3
close sell entry which carried down to 1177.96 which was the .618 retracement of
the intraday 1168.90 low to the 1192.25 high. This
provided another good buy entry right around the open and previous close. This
entry ran to 1191.78, closing at 1191.52.Â
This was more excellent
sequence trading that gave you tremendous profits with the three trending moves
and defined patterns. It doesn’t get any better than that and you were flat
going out overnight.
It was very positive the
way the market shook off the very negative tone of the news,
(
CSCO |
Quote |
Chart |
News |
PowerRating), etc.,
and the analyst hammer on the Semi outlook. Trust me, they are no smarter now
than they were at the highs and all bullish.
The SPX stuck its head up
with a continuation 1,2,3 pattern close on your daily chart, which is good, but
now faces some resistance at the 10-week EMA of 1196, up through the 50-day EMA
of 1214 which is also minor resistance. Fib alert zones above would be:
| .38 | 1196 |
| .50 | 1232 |
| .618 | 1268 |
The Nasdaq 100
(
NDX |
Quote |
Chart |
News |
PowerRating)
ended +1.3% yesterday with what I think was a surprise green finish for almost
all of the
(
JNPR |
Quote |
Chart |
News |
PowerRating)s and
(
CIEN |
Quote |
Chart |
News |
PowerRating)s. This morning, we are up big green at
7.45 a.m. ET, with the S&Ps +17, the Nasdaq futures +42, and almost all of
the usual suspects up strong on Instinet.
Stocks
Today
|
(June
|
||
|
Fair Value
|
Buy
|
Sell
|
|
6.90
|
 8.40 |
 4.95Â
|
I want to short
(
DIA |
Quote |
Chart |
News |
PowerRating)s
into any rally from 102.5 up to 105, which I don’t think they’ll get to. You’ve
got the 50-day EMA and price resistance from 102.5 up through the 105 level.
Other stocks are [
(
VRTS |
Quote |
Chart |
News |
PowerRating),
(
ADBE |
Quote |
Chart |
News |
PowerRating),
(
JNPR |
Quote |
Chart |
News |
PowerRating),
(
NEWP |
Quote |
Chart |
News |
PowerRating),
(
QCOM |
Quote |
Chart |
News |
PowerRating),
(
LEH |
Quote |
Chart |
News |
PowerRating),
(
XOM |
Quote |
Chart |
News |
PowerRating),
(
FLR |
Quote |
Chart |
News |
PowerRating)
(coming out of the Symmetrical Triangle),
(
UTX |
Quote |
Chart |
News |
PowerRating),
(
BA |
Quote |
Chart |
News |
PowerRating) and also
(
GENZ |
Quote |
Chart |
News |
PowerRating),
(
HGSI |
Quote |
Chart |
News |
PowerRating) and the
(
BBH |
Quote |
Chart |
News |
PowerRating)s.
In the Semis, just keep
working the Semi list that I gave you on
Monday for intraday patterns.
Have
a good trading day.
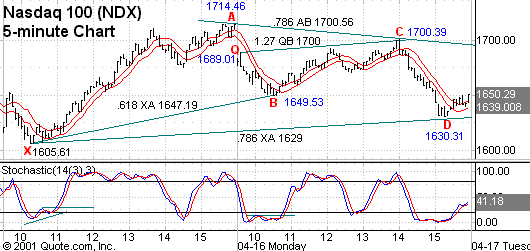
This should be the way
you frame the chart mentioned in yesterday‘s text:

Chart
1. Five-minute chart of Nasdaq 100 (NDX)
April 12/16, 2001,Â
with 8-period high
and low moving
averages.

Chart
2. Five-minute chart of S&P 500 (SPX) with
20-, 50-
and 260-period EMAs.

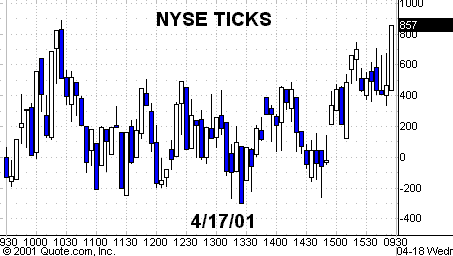
Chart
3. Five-minute chart of New York Stock Exchange Ticks.
Â
Gary
Kaltbaum on TradingMarketsWorld! Gary Kaltbaum will be appearing on the
Intermediate-Term Trading board tomorrow, Thursday, April 19, at 8:00 p.m. ET. Be sure to take
this opportunity to chat with and have your questions answered by a leading
intermediate-term trader. Click
here to take your trading to a new dimension.
