USD/CAD Unleashing Its Fury
For the first time in a long time the USD/CAD is about to do the following;
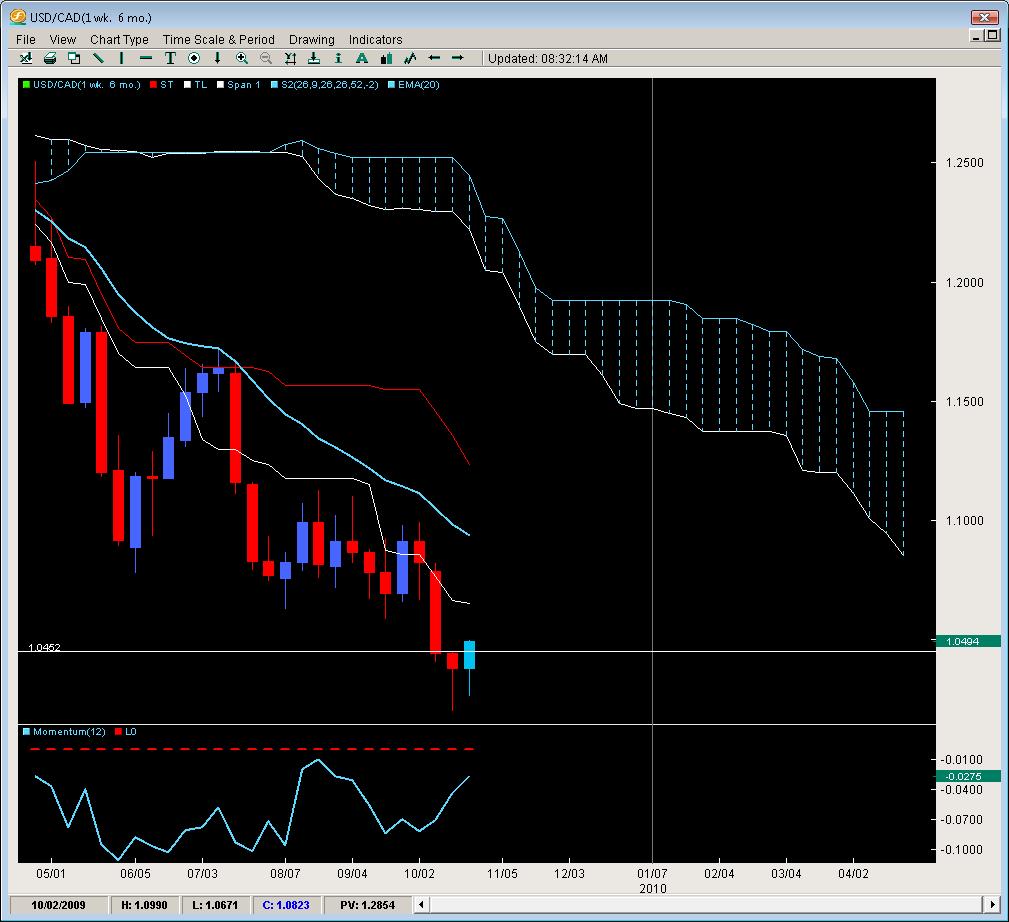
1) close above the previous weeks high (last time was early August 09′)
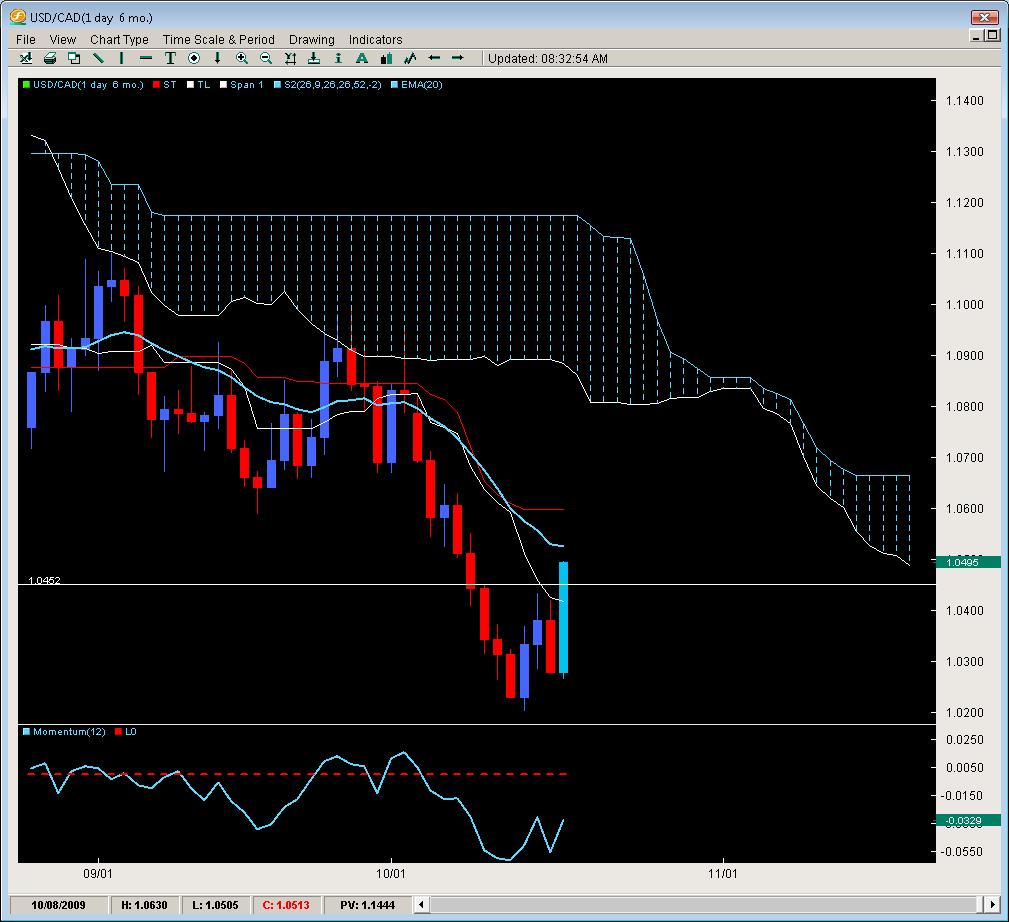
2) have a daily close above the Tenkan line (daily chart – last time was Oct. 1st 09′)
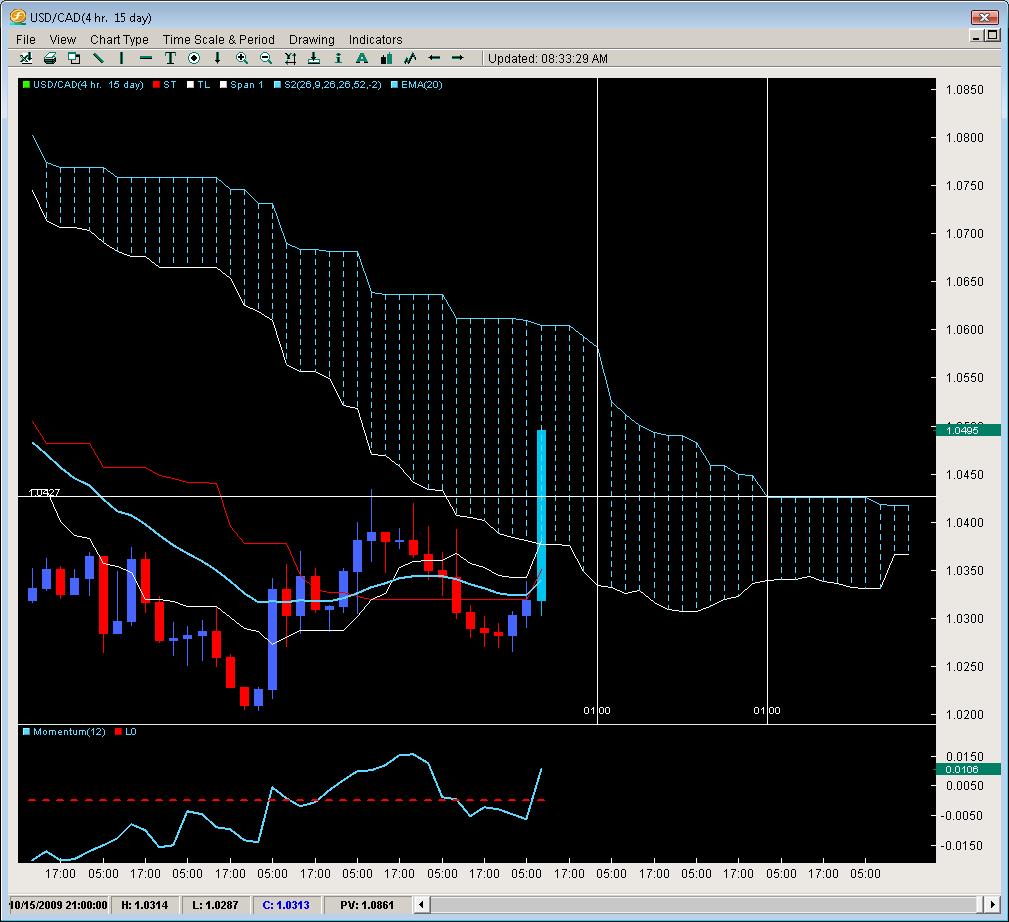
3) close inside the kumo on the 4hr chart (last time was Oct. 4th)
All of this is happening today and with a vengeance. Why do I use such strong language? Because its the most recent price action, particularly the last 4-hour candle which is the cause of all this. This is the single largest top-bottom 4-hour candle in the last 90-days so it stands out in my book. Anything that happens once in every 90-days stands out in my book (particularly meeting with my accountant to do the quarterly taxes – again an event which happens only once in every 90-days).
Thus, in the short term, this is one of the hottest seats at the Blackjack table.
Starting at the weekly chart, you can see the pair is really threatening to post a close above the previous weekly high for the first time in a few months, but what is more interesting is the price action causing this. Last week the pair attempted to form a bottom at 1.0200. This week, in attempting to re-visit that bottom, we fell way short and formed a higher high. The current candle is above the previous weeks high with two strong wicks to the downside suggesting the rejection zone could be the real McCoy. If we get continued follow up buying this week, we could also be creating another reversal candle such as a morning star formation – all supporting the same look – the short term bullish outlook.

Moving down to the Daily charts, the pair is also threatening to close above the Tenkan line for the first time this month. On top of that, its in the same day pushing up against the 20ema. This candle would support the overall short term bullish structure and simply confirm the 1.0200 bottom is not wearing a bullish costume but charging down the streets of Pamplona, Span in July looking to put its horns into some person running with more adrenaline than a 1st time Sky Driver who is afraid of heights and has no life insurance plan. On top of that, the upcoming Kumo is rather anemic suggesting there is a window opening for the bulls to push past the Kumo resistance giving them more ground to trample on.

Lastly, on the 4-hour chart, we have the 1st close inside the Kumo. Notice how price has been below it since the 1.0800 level and most of its time being enlisted below the 20ema and Kijun. This long term pattern has just been interrupted by the most recent 4-hour candle which has taken out all of them and ventured into the Kumo. This further confirms the bulls short term efforts and with the two white lines (acting like field goal posts) present an area where price is most likely to break which could represent a trend change. However, the fact the Kumo is declining during that stretch is not a good sign because it would mean the support of the Kumo is falling thus bringing the floor lower instead of rising (which is what we want in an upward break). Thus, any kumo breaks in this region should be treated with caution because they may want to gravitate towards the flat top ahead. We feel this would be a much better region to enter longs as it happens to coincide with a role reversal level and previous ceiling for the pair.

Chris Capre is the current Fund Manager for White Knight Investments (www.whiteknightfxi.com/index.html). He specializes in the technical aspects of trading particularly using Ichimoku, Momentum, Bollinger Band, Pivot and Price Action models to trade the markets. He is considered to be at the cutting edge of Technical Analysis and is well regarded for his Ichimoku Analysis, along with building trading systems and Risk Reduction in trading applications. For more information about his services or his company, visit www.2ndskies.com.
