Use this tool to forecast the direction of interest rates
Using Relative Strength
to Determine the Direction for the FOMC
In the wake of Katrina, just about every market
pundit has weighed in on whether or not the Federal Reserve should continue to
raise rates, so, as a technician, I, too, have decided to tackle the issue using
my tools of the trade. I know that this topic could be viewed by some as
meaningless conjecture, but, for fun, let’s look at it from a technical view in
order to determine what the facts are.
We need to first determine whether or not the
FOMC will need to raise rates based on the amount of inflation that is in the
economy. This writing will not review CPI or PPI numbers, although they do add
an interesting twist to the topic. To determine inflationary pressures, let’s
first look at a partial trend chart of the iShare Lehman 7-10 Year Treasury Bond
Fund
(
IEF |
Quote |
Chart |
News |
PowerRating) {03/04-09/16/05}. As a review, this is a price chart so it will
go up when rates go down and down when rates go up.
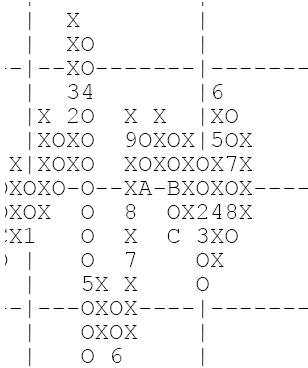
The date of the high on this chart is June of
2003 (not shown). So, basically, short-term rates were at their lowest in June
of 2003. And, currently, prices are forming what could be a symmetrical triangle
but we don’t quite yet have the necessary five points. A larger term view of
this chart would enable us to see that it has basing characteristics with only a
few outliers. So, all in all, prices of short term treasuries are flat with a
downward bias.
Obviously, the Fed’s actions have served to raise
rates (gently) on the short-end. But, what about Alan Greenspan’s famous
conundrum? Why do long term rates continue to stay relatively low? Above you
will also see a partial trend chart of the iShare Lehman 20+ Year Treasury Bond
Fund
(
TLT |
Quote |
Chart |
News |
PowerRating) {12/04-9/16/05}. Long-term rates were actually also at their
lowest in June 2003 (not shown), but made a valiant effort to return to their
lows in June of 2005, even after the Fed had begun their tightening efforts.
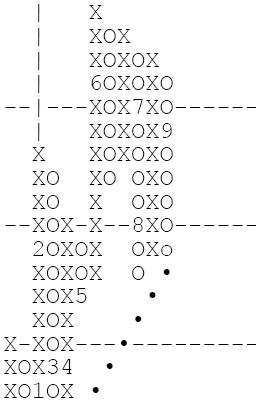
The chart has come down, so the Fed’s actions ARE
working. Plus, the chart has been able to hold its trend meaning that the
actions taken have not caused a dramatic increase in the rise in long-term rates
which is excellent (ensuing a soft landing). Have the Fed’s actions been able to
slow down the economy enough (i.e. keep inflation under control) so that they (FOMC)
can now stop raising rates? To answer that question, let’s compare some charts
on a relative basis. Specifically, the relative strength charts of the iShare
Lehman 7-10 Year Treasury Bond Fund versus the CRB Index and the iShare Lehman
20+ Year Treasury Bond Fund versus the CRB Index.
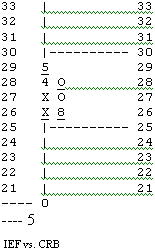
I am using the CRB Index because rising commodity
prices often are inflationary. The chart below is showing that on a relative
basis, the IEF started underperforming the CRB in August. What does that tell
us? A) That commodities are likely to continue their bull market and b) the rise
in rates have not slowed down the increase in commodity prices.
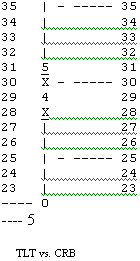
Now let’s look at the TLT versus the CRB Index.
The TLT continues to hold its’ own versus the CRB Index. The long term bond is
continuing its’ out performance.
Next, let’s review the trend chart of the CRB
Index. It is not shown on this chart, but the CRB has been in a strong uptrend
since June of 2003. It started advancing as bond prices were topping. Currently,
it has pulled back to a position that looks promising for new purchases.
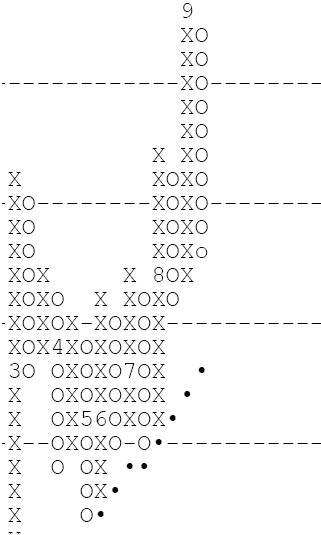
Back to the question at hand, should the fed
continue hiking? Well, because all of the trend charts are positive, we can only
gather meaningful information from the relative strength charts. For the longer
term health of the economy, my conclusions, because IEF has started to under
perform CRB, and commodity prices continue to rise, is that the Fed should
continue to raise rates. Pausing in the wake of Katrina would be a mistake.
Also, increased demand for the rebuilding after the hurricane will also cause
(and has caused) commodity prices to rise. That said, from a technical
viewpoint, I would recommend continued buying of commodities until the upward
trend line on the CRB is broken. Now is fine for the more aggressive trader to
take a position. For the more conservative amongst us, it would be fine to wait
for a hint of buoyancy. We will just have to wait and see what the Fed does and
how it affects the charts.
Sara Conway has been a
registered representative since 2001 at a well-known national firm. Her duties
involve managing money for affluent individuals on a discretionary basis.
Currently, she manages about $150 million using various tools of technical
analysis. Mrs. Conway is pursuing her Chartered Market Technician (CMT)
designation and is in the final leg of that pursuit. She uses the Point and
Figure Method as the basis for most of her investment and trading decisions, and
invests based on mostly intermediate and long-term trends. Mrs. Conway
graduated magna cum laude from East Carolina University with a BSBA in finance.
candsconway@earthlink.net
