Using Gann to Trade the Main Trend
Last month I wrote a broad-based article about Gann Theory. The piece described Gann Theory as the study of pattern, price and time relationships. This month’s article covers the concept of pattern.
When writing about pattern under the context of Gann, the Gann Swing chart is the first pattern which comes to mind. The Gann Swing chart is also often referred to as the Gann Trend Indicator. Creating a Gann Swing Chart is an important first step in using Gann analysis because it identifies the trend and the important tops and bottoms from which to draw the Gann angles. In addition, the chart provides valuable information to the trader such as size and duration of the swings. This information helps the trader find price and time targets and to identify when the market is ahead or behind target.
Click here to order your copy of The VXX Trend Following Strategy today and be one of the very first traders to utilize these unique strategies. This guidebook will make you a better, more powerful trader.
Gann Swing Charts can be created for the minor trend or the main trend. Some analysts prefer the minor, intermediate and main trend outlook. For this article we will use the 2-bar swing chart as our main trend indicator. A 2-bar swing chart measures swings only after the market has made two consecutive higher-highs or two-consecutive lower-lows. A minor or 1-bar swing chart would follow the one day swings of the market.
Before we learn how to construct the 2-bar swing chart let’s look at some of the benefits it has over a minor swing chart.
1. Main trend chart opportunities occur less frequently than minor trend opportunities. This keeps the cost of trading to a minimum.
2. Trading less frequently than the minor trend indicator makes the trader less likely to be whipsawed and also makes the possibility of a long series of losses less likely.
3. Main trend trading opportunities develop more slowly and more predictably than minor trend opportunities. This give the trader time to watch the formation and to make adjustments when necessary.
4. Although the same technique is required to create the main trend chart, and the minor trend chart, the amount of time devoted can be less especially if the market is in a steep uptrend or downtrend.
5. The mental exhaustion caused by frequently changing direction, overtrading, and taking a series of losses is not as common for the main trend trader as it is for the minor trend trader.
CONSTRUCTION
The main trend chart can be used to identify the main trend tops and bottoms for any time period. In order to avoid confusion about whether we are speaking exclusively of the monthly, weekly, daily, or intraday charts, we call each trading time period a bar.
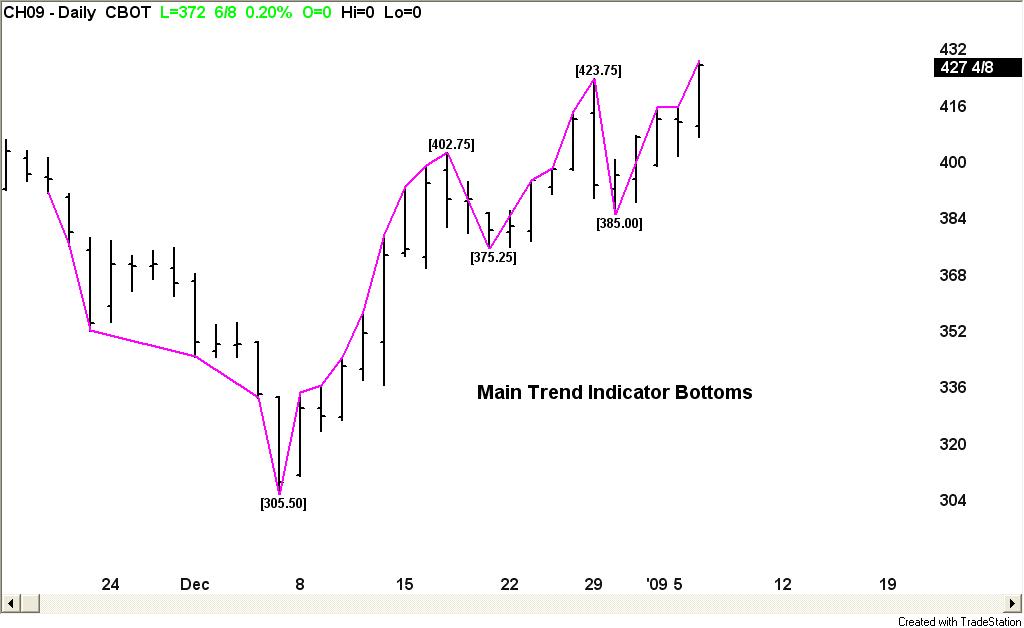
The main trend swing chart, or 2-bar chart, follows the 2-bar movements of the market. From a low price each time the market makes a higher-high than the previous bar for two consecutive time periods, a main trend line moves up from the low two bars back to the new high. This action makes the low price from two bars back a main bottom.
Figure 1:

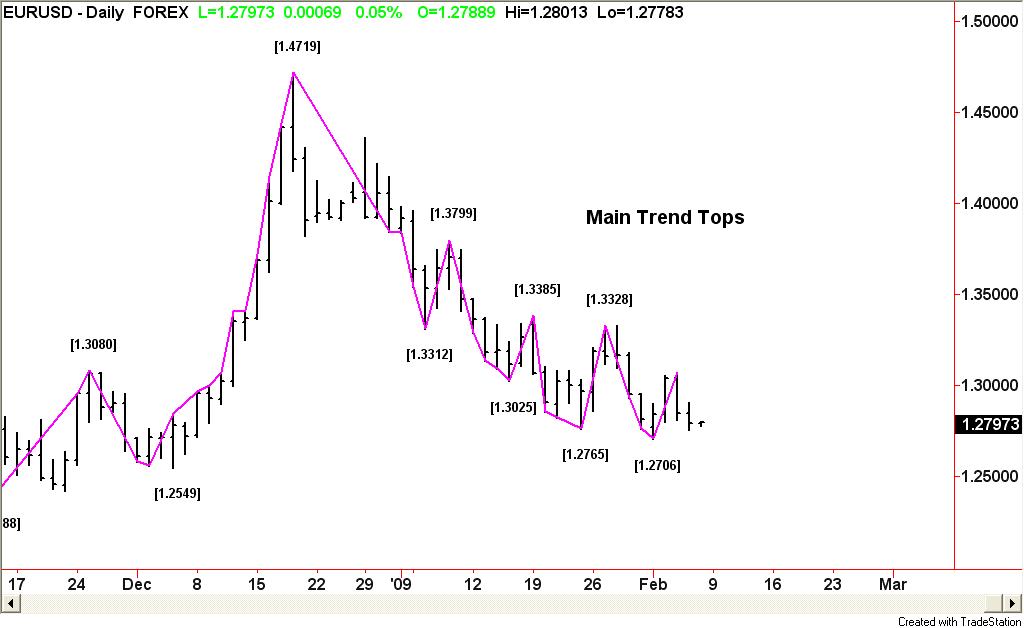
From a high price each time the market makes a lower-low than the previous bar for two consecutive time periods, a main trend line moves down from the high two bars back to the new low. This action makes the high price from two bars back a main top.
Figure 2:

The combination of a main trend line from a main bottom and a main trend line from a main top forms a main swing. This is important information, because when stop placement is discussed, traders will be told to place stops under main swing bottoms, not under lows, and over main swing tops, not over highs. Learn and know the difference between a low and a main swing bottom, and a high and a main swing top.
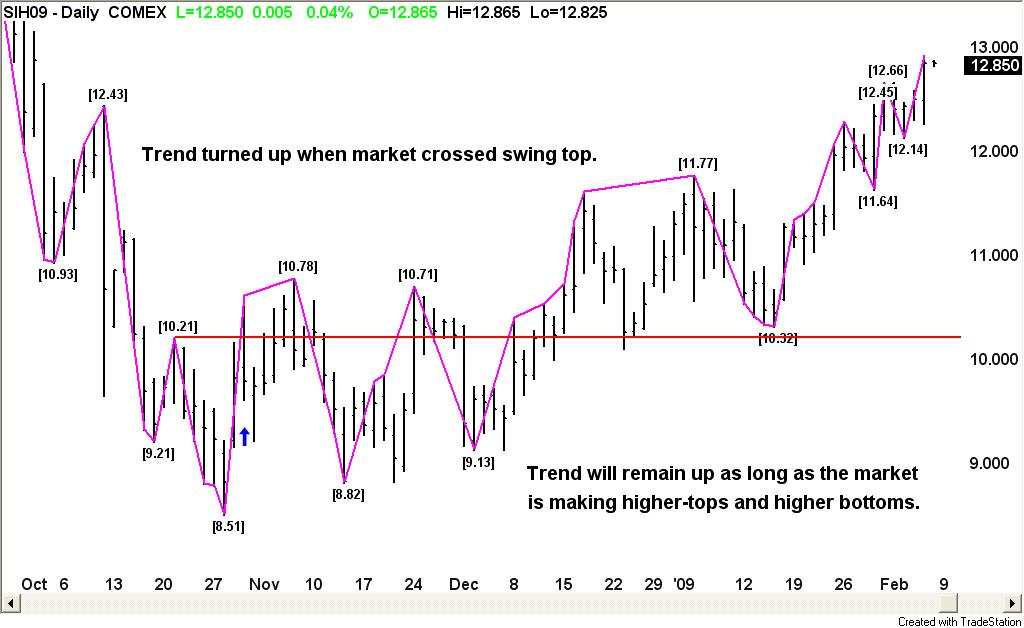
Once the first main top and bottom is formed, the trader can anticipate a change in the main trend. Starting from the first day of trading, if the main trend line moves up to a new high, this does not mean that the main trend has turned up. Conversely, if the first move is down, this does not mean the main trend is down. The only way for the main trend to turn up is to cross a main top, and the only way for the main trend to turn down is to cross a main bottom.
Figure 3:

In addition, if the main trend is up and the market makes a main swing down that does not take out the previous main swing bottom, this is a correction. If the main trend is down and the market makes a main swing up that does not take out the previous main swing top, this is also a correction. A market is composed of two types of up and down moves. The main swing chart draw attention to these types of moves by identifying trending up moves and correcting up moves, as well as trending down moves and correcting down moves.
In summary, when implementing the main swing chart, the analyst is merely following the two-bar up and down movements of the market. The intersection of an established downtrending line with a new uptrending line is a main swing bottom. The intersection of an established uptrending line with a new downtrending line is a main swing top. The combination of main swing tops and main swing bottoms forms the main trend indicator chart. The crossing of a main swing top changes the main trend to up. The penetration of a main trend bottom changes the main trend to down. The market is composed of main uptrends, main downtrends, and main trend corrections.
James A. Hyerczyk is a registered Commodity Trading Advisor with the National Futures Association. Mr. Hyerczyk has been actively involved in the futures markets since 1982 and has worked in various capacities from technical analyst to commodity trading advisor. Using W. D. Gann Theory as his core methodology, Mr. Hyerczyk incorporates combinations of pattern, price and time to develop his daily, weekly and monthly analysis.
His published works include articles for Futures Magazine, Trader’s World, SFO Magazine, Forex Journal, and Commodity Perspectives (Commodity Research Bureau), and, his book Pattern, Price & Time published by John Wiley & Sons, Inc. in 1998.
