Watch the SOX, it’s leading the market
The broad market suffered its third consecutive session of losses yesterday, as downward momentum generated from the prior two “distribution days” accelerated. Small cap and Nasdaq related stocks were hit the hardest, but the market’s losses were rather broad-based. The Russell 2000 Index swooned 2.3% and the Nasdaq Composite plummeted 1.7%. The S&P 500, Dow Jones Industrials, and the S&P Midcap 400 Index each lost 1.1%. Although yesterday’s action surely did not please long-term investors who never sell short, it was ideal for short-term traders because each of the major indices trended smoothly and steadily lower throughout the entire session. Per yesterday’s Wagner Daily, we shorted SPY near the open and are currently showing a marked to market profit of 1 point.
Despite substantial losses across the board, volume in both exchanges came in slightly lower than the previous day’s levels. Total volume in the NYSE was 2% lighter, while volume in the Nasdaq declined by 5%. The lower volume prevented the S&P and Nasdaq from sustaining a third straight “distribution day.” Nevertheless, volume came in above average levels in both exchanges. Market internals steadily deteriorated as the day wore on and finished quite negative. Declining volume exceeded advancing volume by nearly 5 to 1 in both the NYSE and Nasdaq, as declining issues outnumbered advancing issues by more than 3 to 1.
One driving factor behind the Nasdaq’s slide yesterday was the break of the 200-day moving average support in the Semiconductor Index
(
SOX |
Quote |
Chart |
News |
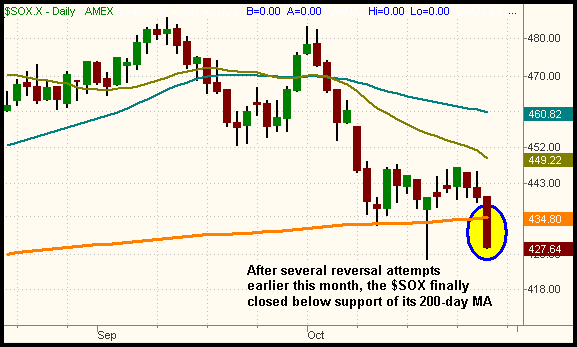
PowerRating). The SOX first dropped down to its 200-MA on October 12, but it rapidly bounced off of it. Five days later, the SOX washed out the bears by trading well below its 200-MA on an intraday basis, but reversing to finish the day above it. The result of that action was the formation of a bullish “hammer” candlestick, but the pattern failed to reverse the October downtrend. Yesterday, for the first time since May 12, the SOX closed below support of its 200-day moving average. Because the semiconductor stocks are so heavily weighted within the Nasdaq, the 2.7% decline in the SOX acted as a boat anchor on the Naz. The daily chart of the SOX below illustrates the break of key support. Also notice that the sector closed at its intraday low:
 
Needless to say, yesterday’s action in the SOX does not bode well for the Nasdaq, nor the entire broad market for that matter. After trading back above its for only six days, the Nasdaq Composite also closed below support of its 200-day MA as well. Prior support becomes the new resistance after support is broken, so expect the 200-day moving averages to generate strong resistance on any subsequent rally attempt in the SOX or Nasdaq.
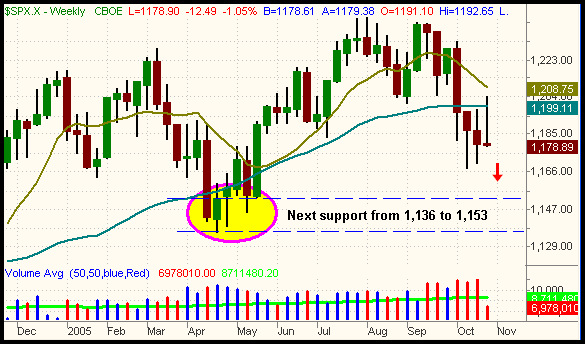
As discussed yesterday, the S&P 500 never managed to recover above its 200-day MA since falling below it on October 5. Yesterday’s 1.1% slide puts the index only a few points above its October low, which is likely to be tested within the next one to two days. If the S&P breaks the October low, the next major area of support on the weekly chart is the lows of April and May 2005. This range of support from 1,136 to 1,153 is circled on the weekly chart below:
 
Given the overall technical picture of the major indices, we feel there is a good chance the S&P will soon break its October low and resume selling off down to the area of support circled above. As such, our plan is to remain short SPY and simply trail a stop along the way to protect our profit and maximize the gain.
(
DIA |
Quote |
Chart |
News |
PowerRating) (Dow Jones) and
(
IWM |
Quote |
Chart |
News |
PowerRating) (Russell 2000) are also good candidates to short in anticipation of a drop to their prior lows from April/May.
(
MDY |
Quote |
Chart |
News |
PowerRating) (S&P Midcap 400) has been showing relative strength to the other broad-based ETFs, but it looks good for a short as soon as it breaks its 200-day MA.
As for the long side of the market, there are very few sectors we would buy right now. The one exception is the Gold ETF
(
GLD |
Quote |
Chart |
News |
PowerRating), which continues to consolidate near its all-time high. Former market-leading sectors such as Oil, Utilities, and Home Construction have reversed their trends, but there has been a lack of sector leadership to fill the void. When a market lacks leadership that should occur from institutional sector rotation, it is a bearish sign for the overall health of the market. Therefore, even if you find a few stocks or ETFs that look good for long entry, it doesn’t pay to fight the trend. We know it’s an over-used
cliché, but the trend really is your friend!
Open ETF positions:
Short SPY (regular subscribers to The Wagner Daily receive detailed stop and target prices on open positions and detailed setup information on new ETF
trade entry prices. Intraday e-mail alerts are also sent as needed).
Deron Wagner is the head trader of Morpheus Capital Hedge Fund and founder of Morpheus Trading Group (morpheustrading.com), which he launched in 2001. Wagner appears on his best-selling video, Sector Trading Strategies (Marketplace Books, June 2002), and is co-author of both The Long-Term Day Trader (Career Press, April 2000) and The After-Hours Trader (McGraw Hill, August 2000). Past television appearances include CNBC, ABC, and Yahoo! FinanceVision. He is also a frequent guest speaker at various trading and financial conferences around the world. For a free trial to the full version of The Wagner Daily or to learn about Deron’s other services, visit morpheustrading.com or send an e-mail to deron@morpheustrading.com .
